Built-in Analytics in Power BI - Part 2 - Analyze
In this part of the series we will look into the different Analyze options of Power BI.
Previous part of this series can be found here.
Explain the Increase/Decrease
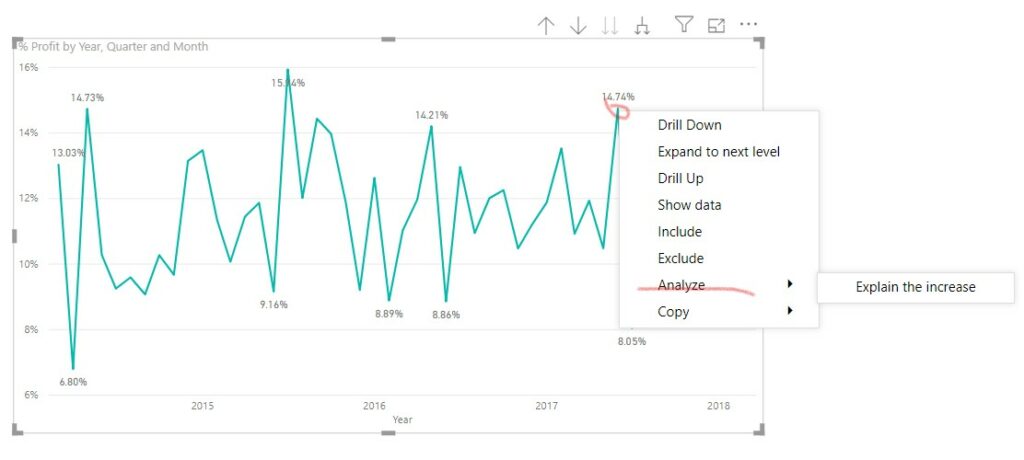
This is the first type of the Analyze features. If your visual is containing a date dimension than by right clicking on any point you will be able to see Analyze -> Explain the (increase/decrease).
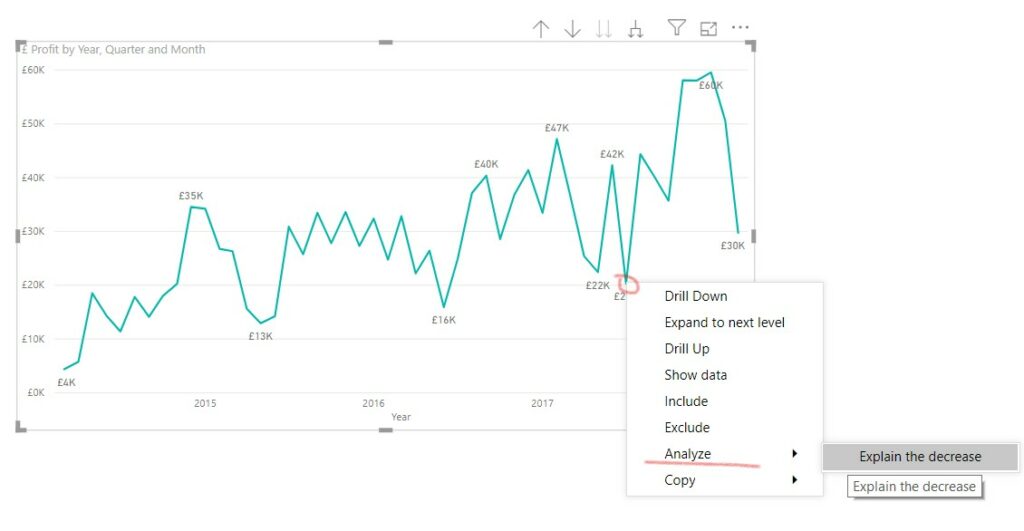
This functionality then automatically try to find statistically significant differences between the selected and the previous point. In this example between July and June 2017.
The way it works is to create 2 measures. One for each point. Than it applies various dimension values to these 2 measures and ranks them by the difference.
It is generating this popup view, where you can scroll through the findings.
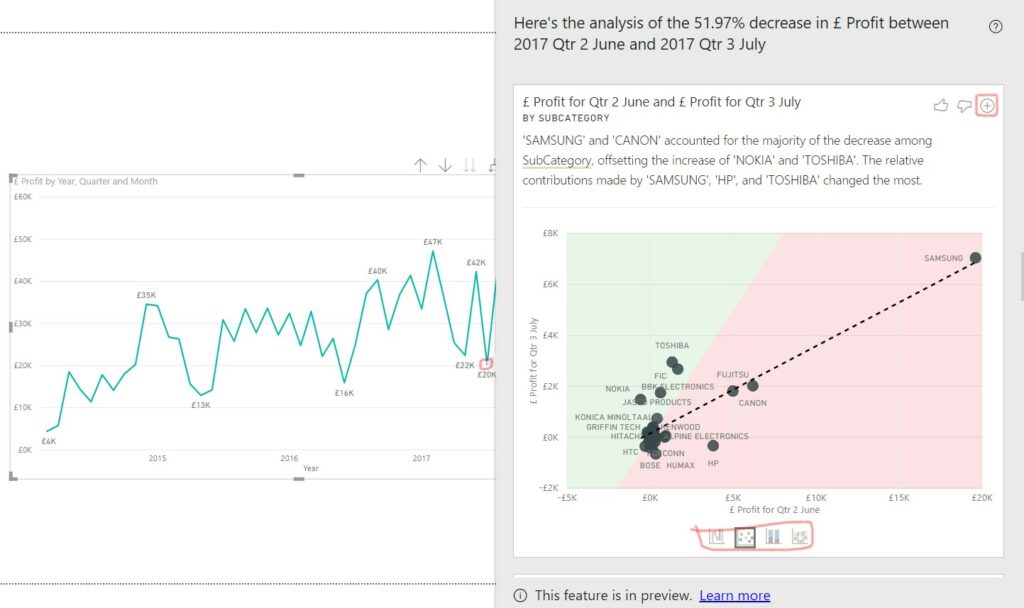
- On the top you will see a short description of the analysis
- In the bottom of each visual you are able to change the visualization type.
- In the top right corner with the plus icon you can add the selected visual to your analysis. (If you are in desktop or in edit mode)
Actually this feature comes in 3 flavors, dependent on the kind of calculation we use it on. The most common one is this, when the measure calculation uses "SUM".
Using with average measures
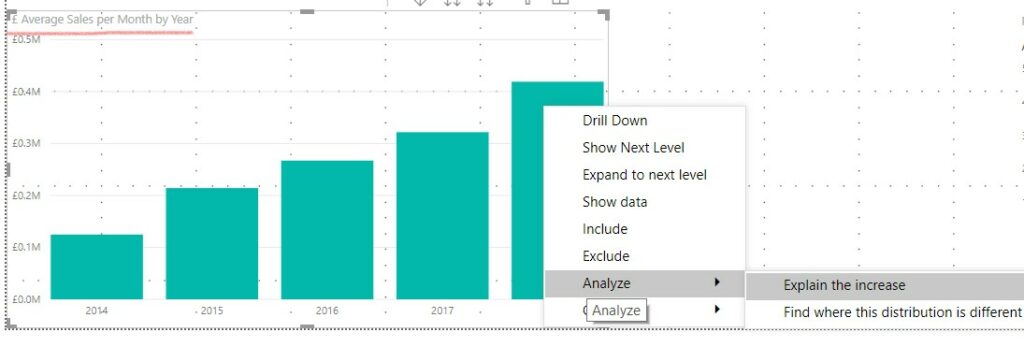
In this second example I want to use this feature to show me the difference between the average sales per month between 2 years.
As you can see based on the dimension and the chart type 2 Analyze options are visible. We will talk about the second one a bit later.
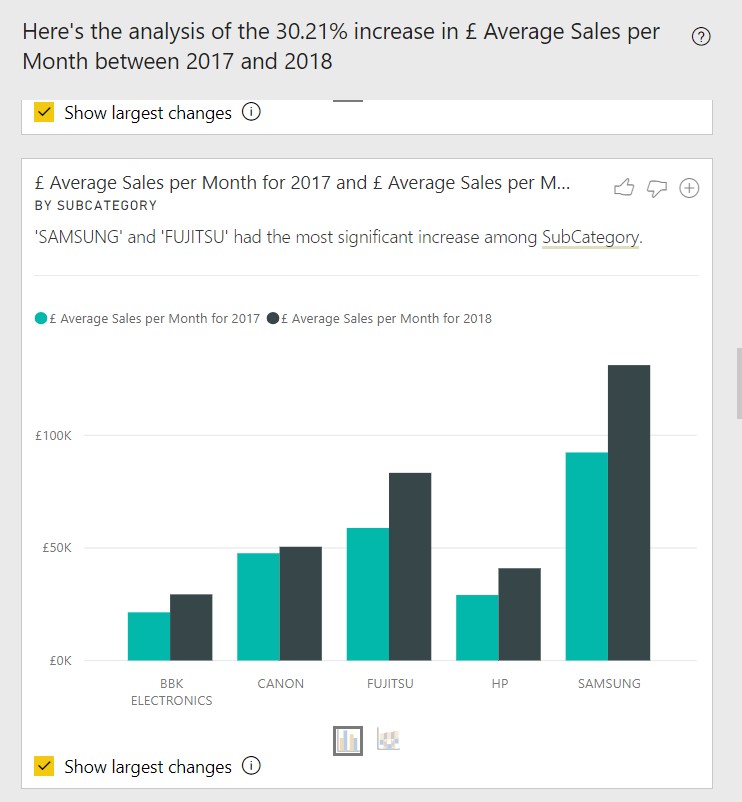
What you can see here is that :
- there are fewer visual options
- you can select if you want to see the largest changes (default), or all the values.
Using with percentage measures
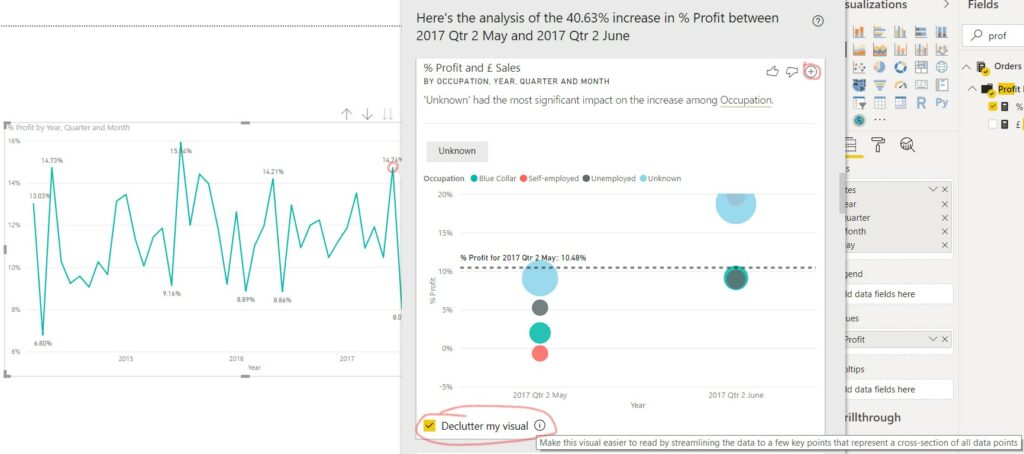
The third version is if you want to use it on semi-additive measures like a profit % in this example.
Difference here are:
- There is only 1 visual option that shows you the difference between the to periods.
- You have the option to declutter the visual (default), that only shows the biggest changes.
Explain where the distribution is different
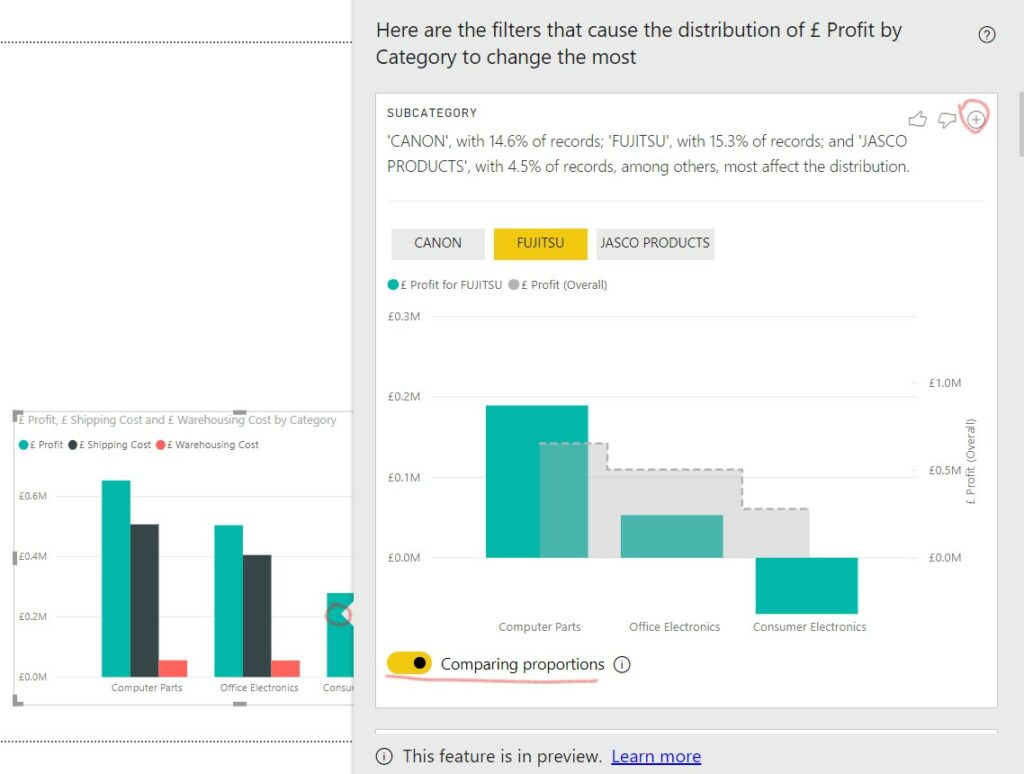
The other Analyze option is showing you if there is significant difference between the distribution of the measure from the original distribution in the visual.
This one is maybe bit harder to grasp first.
In this example what you can see:
- grey dashed line is the original distribution of the profit by product category
- bars are the distribution of profit if we filter down to Fujitsu products.
How to understand the meaning of this?
In this example the findings show the these 3 products subcategories (brands) had the biggest effect on the distribution of profit. Fujitsu is responsible for 15% of the products and it has a significantly different distribution that the overall numbers.
So one of the reasons that Consumer Electronics have a lower overall profit than Office Electronics is because Fujitsu had negative profit in Consumer Electronics.
Limitations
- Not all visuals have these functions. Mainly bar and line charts.
- It won`t work with any type of data connection. Import mode is the best.
- It mostly works with simple measures. Use of certain DAX functions (filters, iterators, etc.) disables this functionality. Will be posting about this soon.
- It works best in a well prepared and clean data model. Will be a post about that later also.
Conclusion
These solutions are really effective way to answer question on the fly, for example in a meeting. Make sure you fully utilize it`s capabilities by preparing and testing the data model you use for your reports and using the right visuals.
