Hidden features of Analyze in Excel - Part 1 - Show me the details
Why focus on Analyze in Excel?
In my previous post about Organizational Data Types I introduced this chart showing the potential reach of certain features in an organization. There we covered the widest reaching feature.
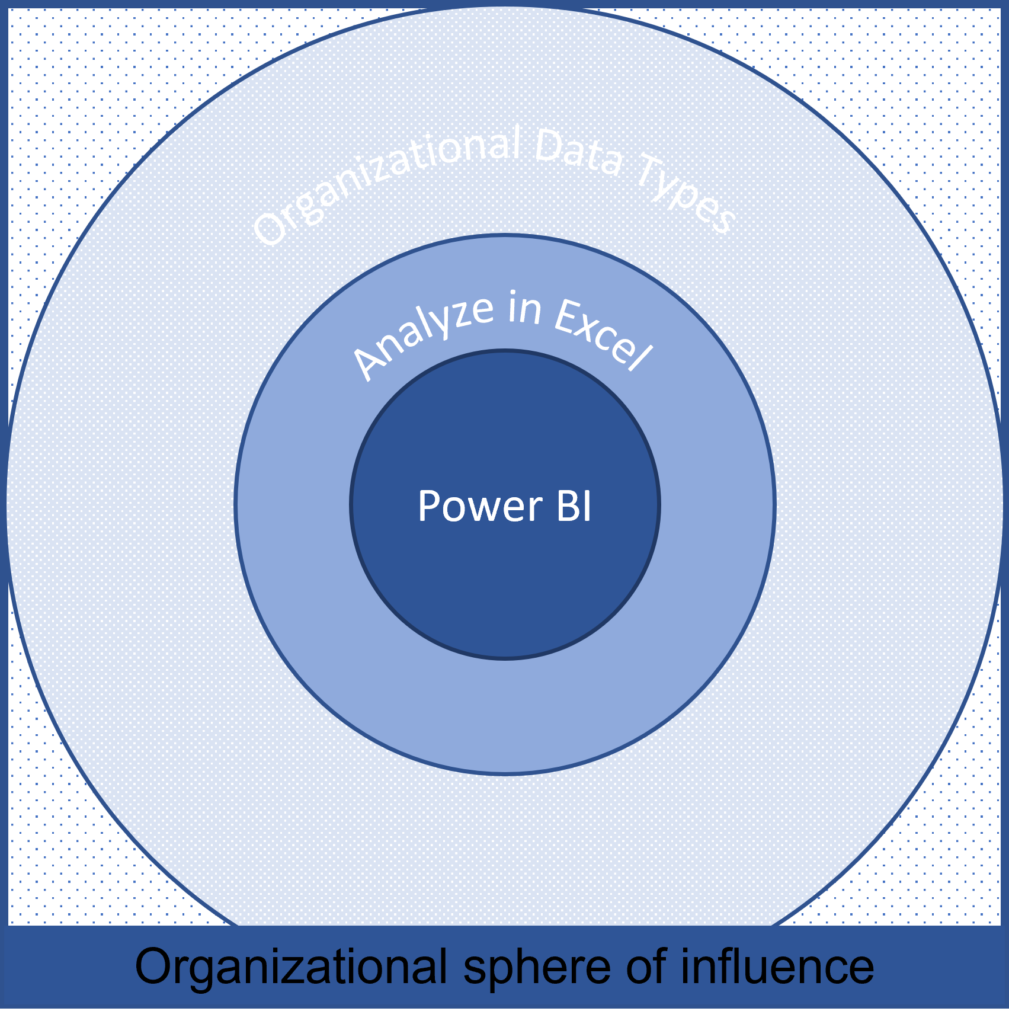
In this series I would like to cover some hidden features of Analyze in Excel. These will improve the usability of your solutions and solves some of the issues you would face on your adoption journey to Power BI. There is an Adoption Roadmap available that also talks about the challenges.
Not everyone will want to use Power BI in an organization, but that does not mean we should not focus on them too. We need to reach people where they are currently and not necessarily force them to change.
Show Details
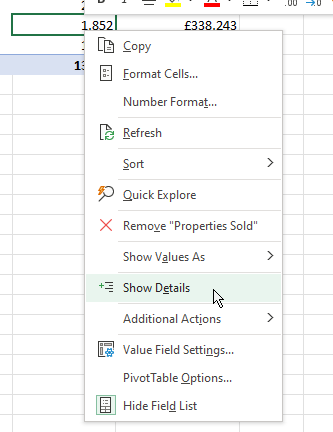
In a Pivot table there is a standard feature called Show Details. This gives a filtered view of top 1000 rows based on our selection.
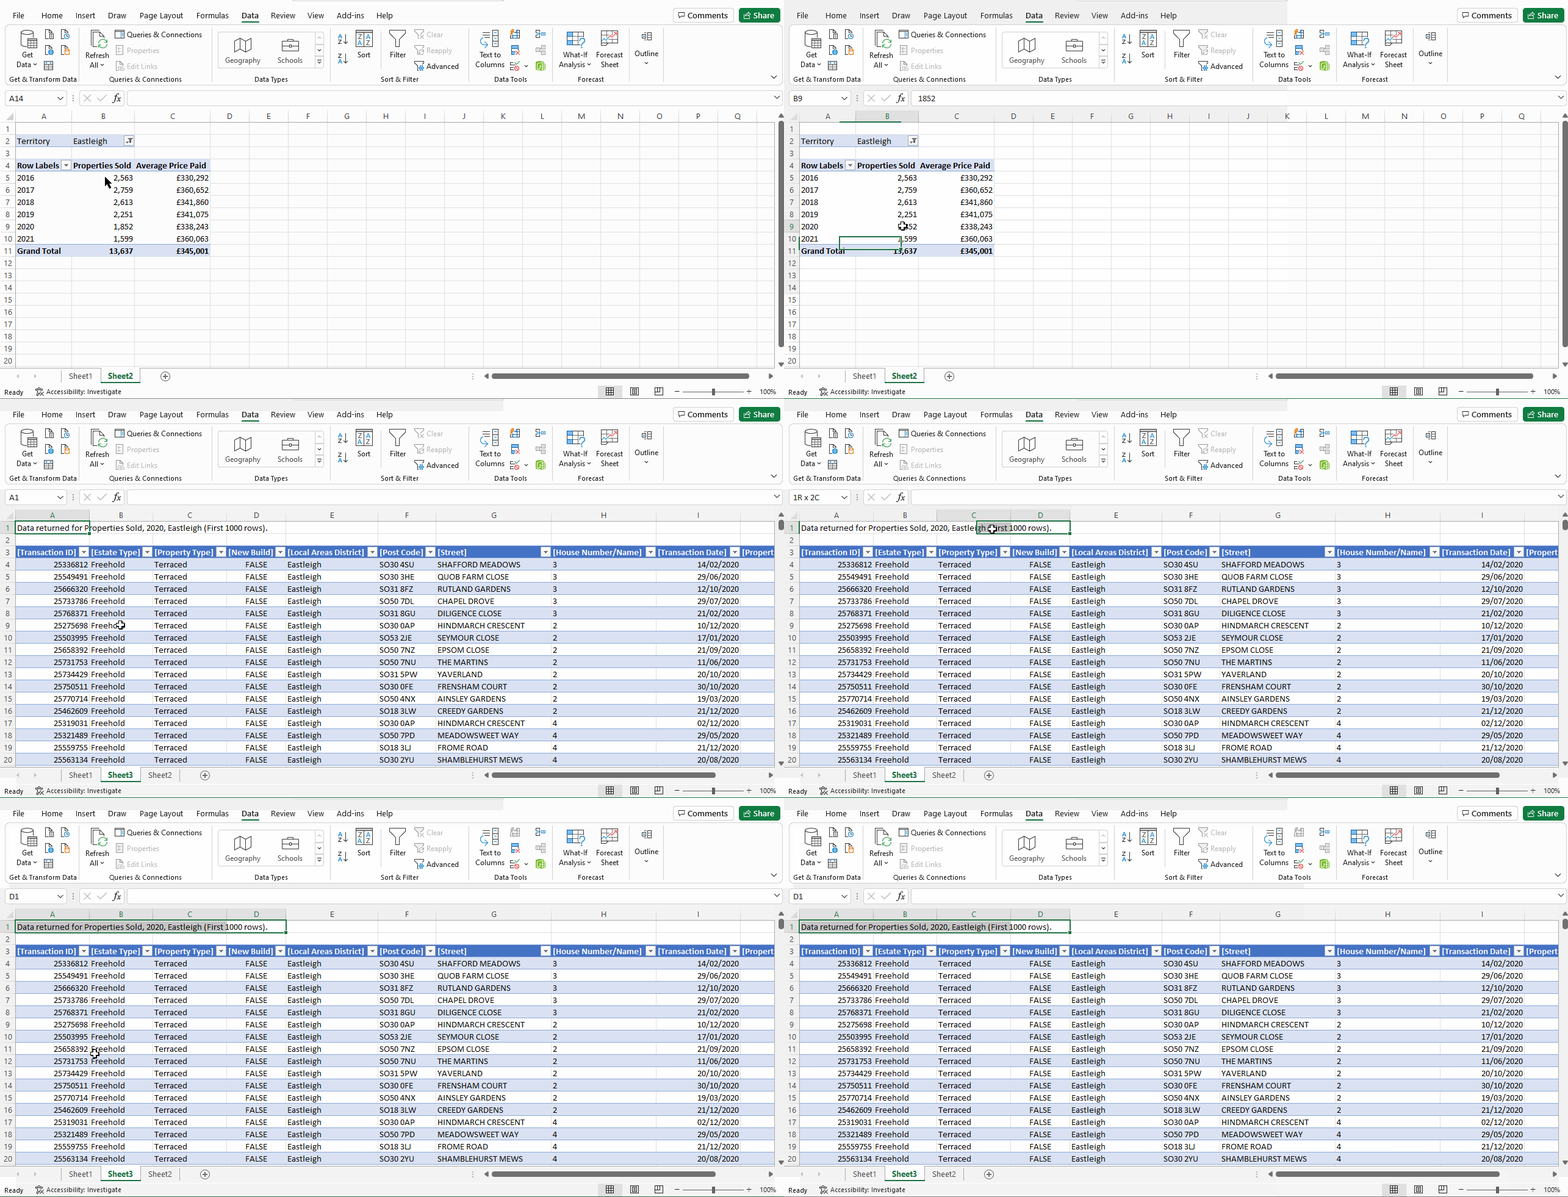
While it works with standard pivot tables by default, this behaviour changes when we use Analyze in Excel.
Data Model
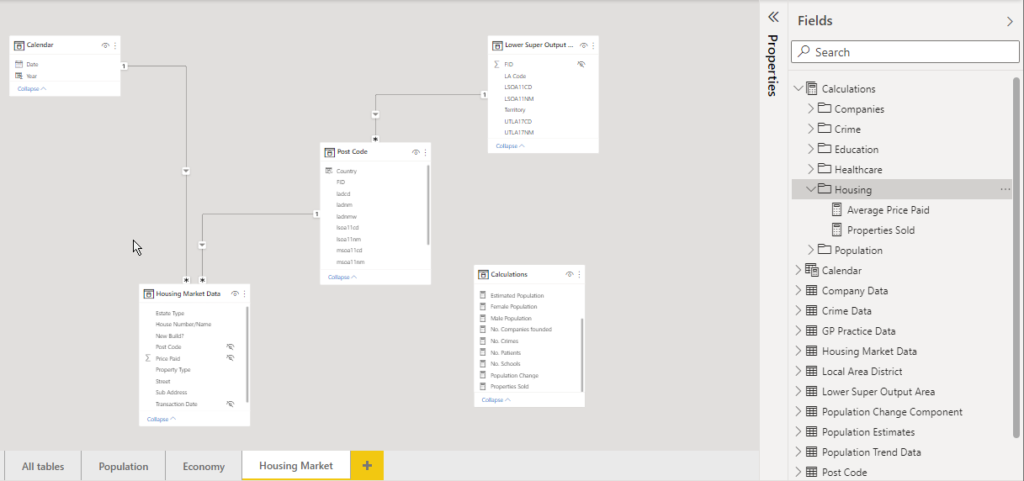
First let's understand the data model we are going to use with Analyze in Excel. This is a fair straightforward subset of a bigger model.
- One fact table - Housing Market Data
- Three dimension tables - Calendar, Post Code, Lower Super Output Area
- Calculations table that only contains measures organized into folders (following Power BI data modelling best practice)
Standard experience
Let's see what happens when you try to use Analyze in Excel with this standard model.
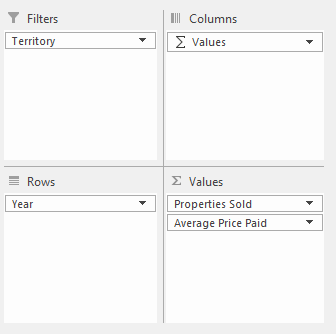
After connecting to the published dataset, it is straightforward to use the pivot table as expected. If you want to see the details, you can double click on the cell...
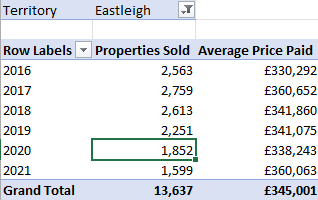
...or right click and select Show Details
What you would expect is a nice table of columns from the Housing Market table with the filtered rows. This is how it works with simple Excel pivot tables.
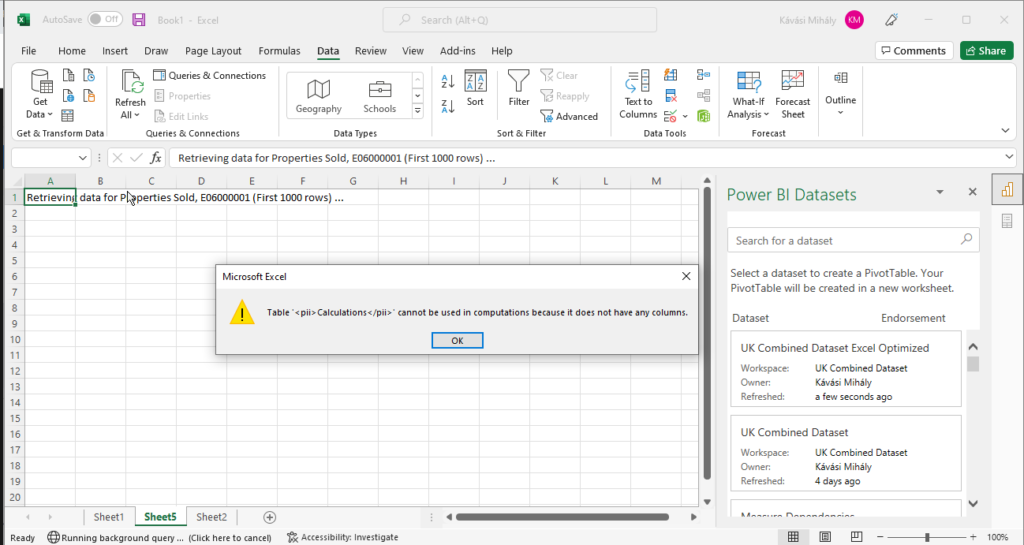
Instead, this screen is going to welcome you. But why?
Because we are using a Power BI data model, the measures are in their own data table, which does not have any columns or rows.
What if the measures are in the fact table?
We would still have a problem because it would exclude all the relationship columns like date and postcode in our example, losing valuable information from the details.
So, using Power BI have some limitation for Excel users?
How to see the details - Detail Rows Expression
To solve this issue and even provide better results we need to use Tabular Editor.
The rows that are displayed on Show Details are dependent on the measures. To determine which columns should appear we need to provide a Detail Rows Expression.

Because we are using a data model, we are not just limited to columns from one table, but any related information can be added to it.
You will see a sample Dax query that I used for this blog post. The best way to design a query for your data model is to use DAX studio.
Detail Rows Expression sample:
SELECTCOLUMNS(
'Housing Market Data',
"Transaction ID", [Transaction ID],
"Estate Type", [Estate Type],
"Property Type", [Property Type],
"New Build",[New Build?],
"Local Areas District", RELATED('Local Area District'[LA Name]),
"Post Code",RELATED('Post Code'[Post Codes]),
"Street",[Street],
"House Number/Name",[House Number/Name],
"Transaction Date",RELATED('Calendar'[Date]),
"Properties Sold", [Properties Sold],
"Average Price Paid", [Average Price Paid]
)
Default expression
If you have a lot of measures it could seem like a lot of work to add this to each of the measures. If you would like the same expression for all the measures in a table, then you can use the Default Detail Rows Expression setting for the table.

You are still able to add specific expression to certain measures if they need to differ.
Summary
Using Detail Rows Expression, you can ensure that the Excel users do not feel that they lost a valuable feature because of Power BI, instead they not have an even better version of that.
Hope you like this blog post, the next part will arrive shortly.
