Built-in Analytics in Power BI - Part 1: Visuals
In this blog series, I will cover all of Power BI's built-in analytical capabilities. Basically, anything that doesn't require you to know the DAX (Data Analysis Expressions) language.
These can help you find insight, or even uncover valuable information that otherwise could have been overlooked.
The Analytics Pane
The simplest, but undoubtedly the most versatile area, is the Analytics Pane.
These options can help you add context to the numbers you want to visualize, like which product produces above average sales or which shops reached the desired profit %.
These options can be found under the Analytics Pane as shown in the picture.
Not all visuals have multiple analytics options.
Constant line is available on most of the column, bar, and line charts.
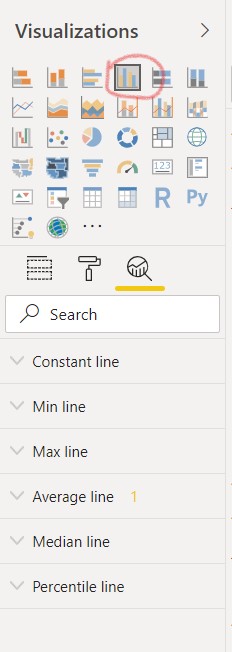
The following charts have additional options:
- Clustered Column Chart
- Clustered Bar Chart
- Area Chart
- Line Chart
- Scatter Chart
Clustered Column Chart
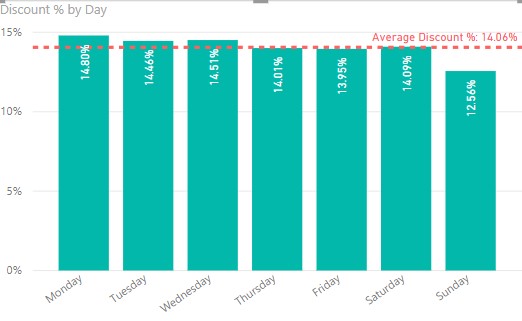
This chart type gives you basic analytics options, such as: Constant Line, Min, Max, Average, Median and Percentile Line
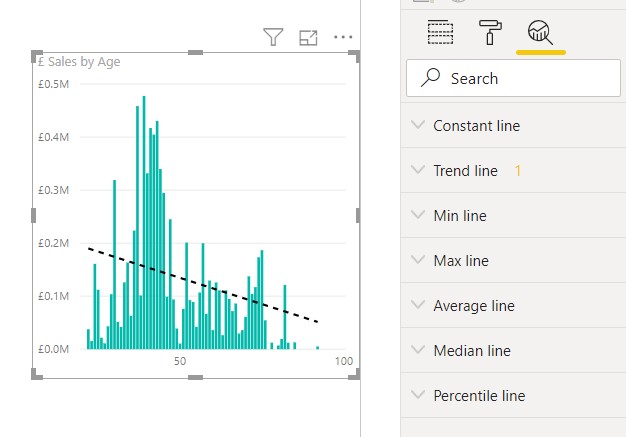
If you use a numeric value as a dimension like Age in this example, you get 1 additional option, the Trend line.
Line Chart
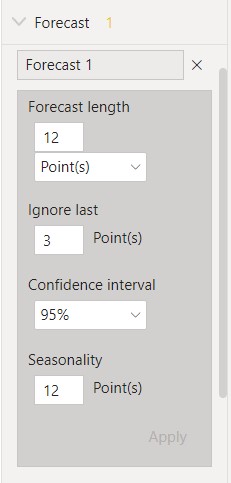
Line charts have 1 additional feature which is the Forecast.
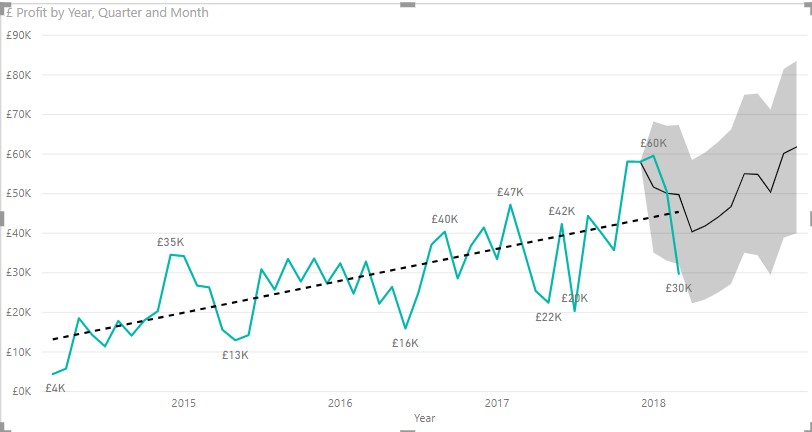
Neither the Trend line, nor the Forecast calculation logic can be changed currently. Also, Forecast only works if 1 line is visible in the visual.
In the forecast, you can set the length of the forecast and the seasonality.
This will help create a more accurate forecast value.
Ignore last is a really useful setting. It will ignore the last number of points in the visual when calculating the forecast.
It has two use cases. First, it helps you ignore the data points that are not yet finalized, like the last month that is not a full month. Or there can be modifications in the data for the not closed quarter.
The other is to test if the forecast it generates actually fits with your data. You can see the forecasted band and the actual value next to each other.
Scatter Chart
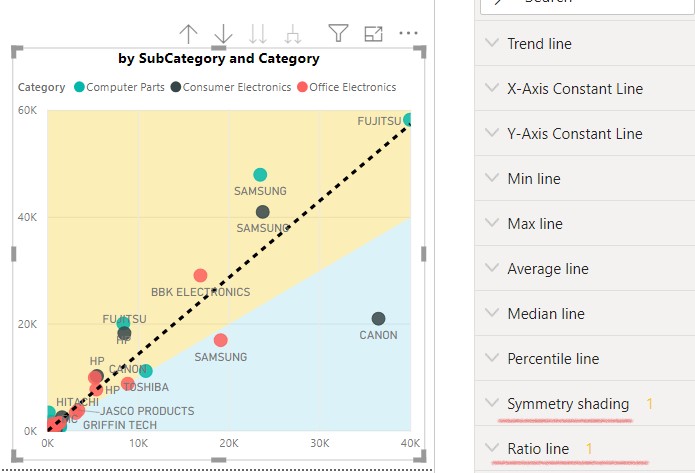
In my opinion, Scatter Charts are one of the best visuals. They can give you tons of insight with a really small footprint. They're mainly used for uncovering correlation between 2 measures.
Scatter Charts will give you 2 more additional options:
Symmetry shading
The colored yellow and blue (colors can be changed) background makes it easy to see if the Y or the X axis value is bigger. The border between the 2 colors, where the X and Y axis value is the same.
Ratio Line
This will be the linear regression line that can be drawn using the visible point and can be used as an average. It will help you quickly see if on average the X or the Y value is bigger. You can also determine which points are above or below the average, making it easier to compare 2 distant points with each other.
In this example we are looking at sales between 2 months:
We can easily see, using their built-in analytical features, that (on average) the sales represented in the Y axis are bigger. Also, we can see that Fujitsu in Computer Parts (top left point) had the highest Y value but Fujitsu in Consumer Electronics (black point in the bottom right quarter) increased more percentage wise from the previous month because it is further from the Ratio line.
Charts with built-in analytics
There are a few charts that have built-in analytical capabilities as default.
These two standard visuals have it:
Ribbon Chart
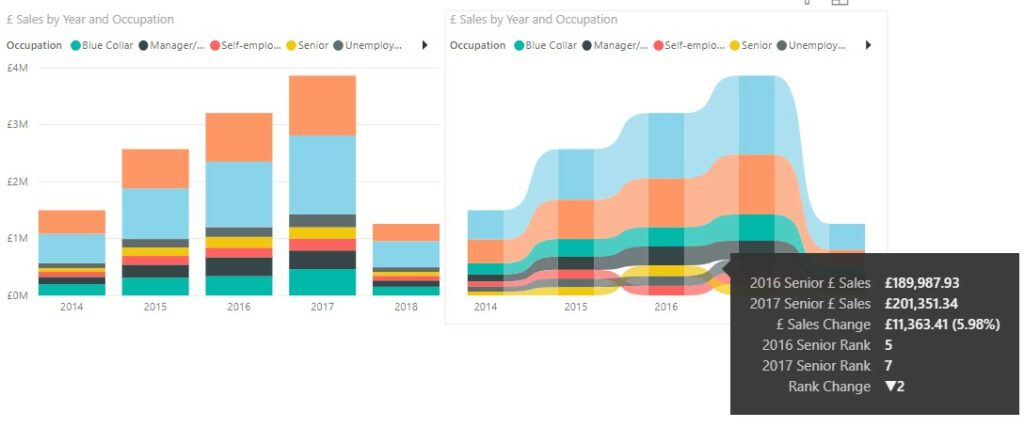
This can be used as a substitute for Stacked Column Chart.
In a Column Chart, the order of the legend will always stay the same regardless of the values. In a Ribbon Chart, the order is determined by the values, so it is easier to see any changes in the proportion.
Also, if you hover over to the ribbon area between the column, you will get a nice little analysis as shown above.
Waterfall Chart
These are a must in all financial reporting, and previously they were a pain to create in Excel.
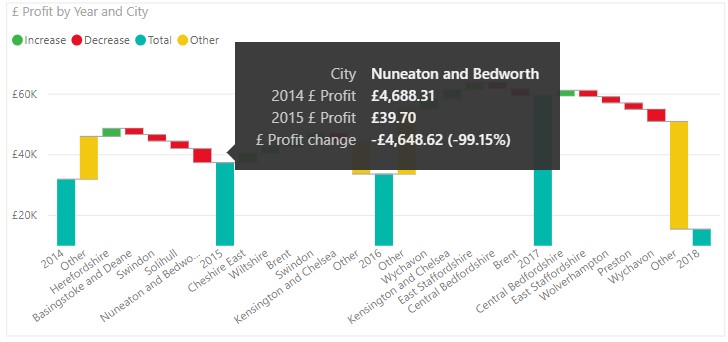
In Power BI, this chart type has a nice feature where you can easily change the number of top changes visible. Also, you'll get a small analysis in the tooltips about the change visible.
The next part in this series will be about different types of Explain features.
Hope you liked this post.
