
Documenting Power BI - Data model V2 - Now with VertiPaq included
It has been a while I published about Documenting a data model in Power BI. I thought I would update the solution with some added features to make the documentation more complete.
Updated the meta data that can be extracted from the tabular model but also expanded with data related metrics that are not part of the model by default. Also, now there is a script for the relationships instead of the original method that you can run.
Additional attributes
I have added a few more details to the documentation:
- SortByColumn
- SummarizeBy
- SourceColumn
- IsAvailableInMDX - will write a short blog post about this soon.
- IsUnique
- Annotations for VPAX details - more in this in the next section
Adding data related metrics
There is an interesting blog post from Michael Kovalsky about how to add VertiPaq details to the BIM file. Link: https://www.elegantbi.com/post/vpaxtotabulareditor
What is VertiPaq?
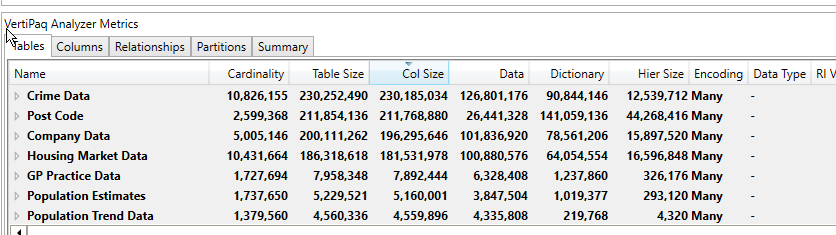
In DAX Studio you can analyze the metrics of a data model. This is based on the actual data that is contained within your data model. This is a valuable information what you cannot get by simply analyzing your model structure which is what the BIM file contains in Tabular Editor (link to free version).
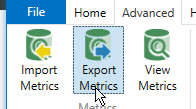
To export these metrics just select Export Metrics from the Advanced menu in DAX Studio.
What are the main Vertipaq metrics?
Table
- Row count
- Table Size
- Table Size % of Model
Column
- Cardinality
- Column Size
- Column Size % of Table
- Column Size % of Model
Relationship
- RI Violation Invalid Rows - you can read about this in more detail here.
Importing VertiPaq
Here is an example adding Vertipaq information to a data model:
Note 1: To see the annotations you need to turn on Unsupported Power BI features at the Preferences.
Note 2: Because these are data related information make sure to update frequently to represent the current data.
Using the documentation scripts
You need to insert the code into the Advanced Editor section of Tabular Editor and run it. Then you can export the results and paste it into the documentation file.
Note: sometimes you need to modify the PQ because of the different header for the synonym columns (ex. Synonyms[en-GB] vs Synomyns[en-US])
Summary
I created two versions of the scripts and files so you can use with or without Vertipaq info.
You can find both solutions in my GitHub repo here.
Hope you like this blog post and it helps you documenting your Power BI report easier.