Hidden features of Analyze in Excel - Part 3 - Focus
In the first two parts (part 1 and part 2) of the blog we explored the Show details functionality of a Pivot table in Excel. Now we look at another hidden feature that will help you limit distractions.
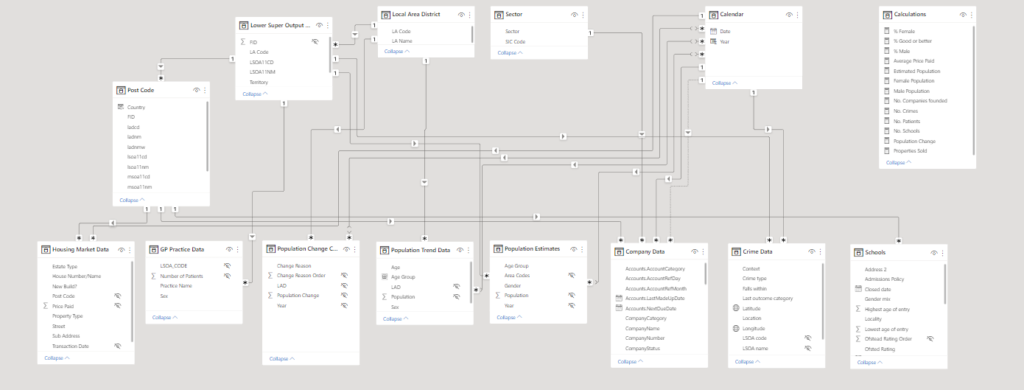
Whenever you connect to a Power BI dataset you immediately see the whole model. The issue is that many models contain a lot of tables, columns, and measures.
Most of them irrelevant to your current analysis.
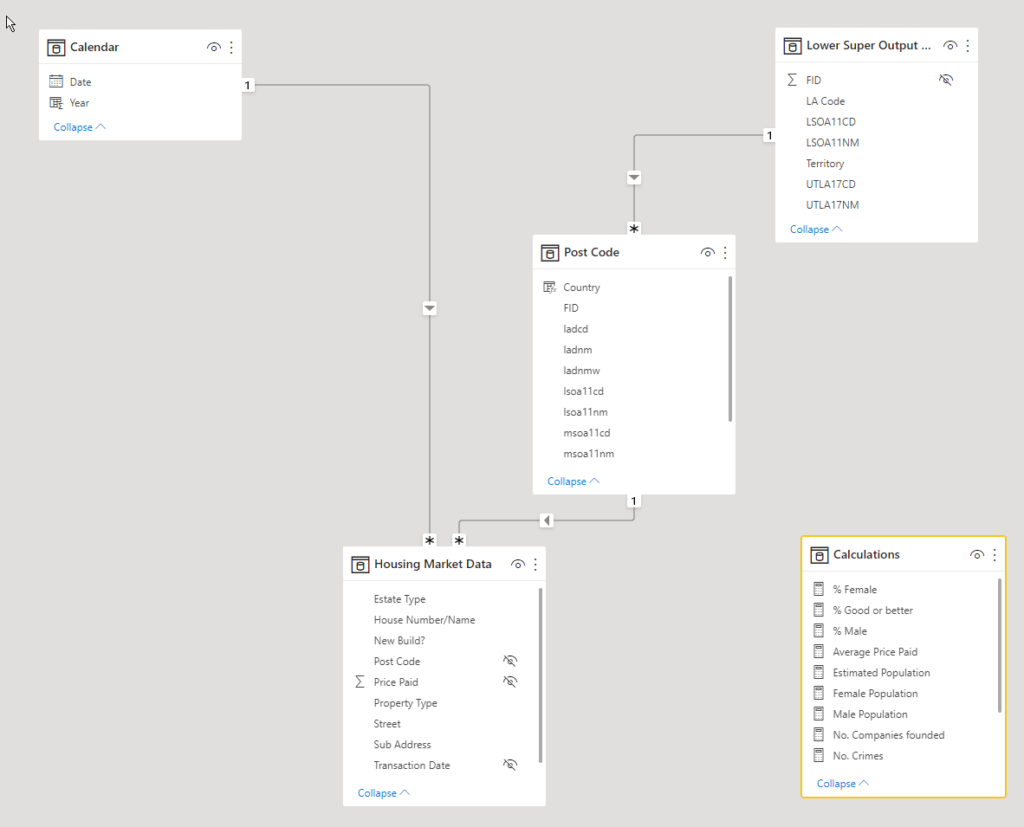
Which model would you rather work with?


When creating the dataset there is usually a desire to make it as comprehensive as possible, but it comes with a cost. Using it can become confusing and complicated for the business users. I have a blog post talking about the differences between making a data model for yourself and others, which talks about these challenges.
In that post I talk about the different approach that you need to take when designing a dataset for someone else to use. This is even more true to the Excel users. But we have a "secret" tool to make their life much easier called perspective.
What is a perspective?
"Perspectives, in tabular models, define viewable subsets of a model that provide focused, business-specific, or application-specific viewpoints of the model." - AAS documentation. In Power BI it is used for supporting the Personalized Visuals feature.
By default, you cannot use them when creating Power BI Report. Creating them also not available in PBI Desktop. You need to use Tabular Editor.
Tip: In Premium, using the Analysis Services connector, the perspectives are accessible in Power BI Desktop.
Using perspectives in Excel
In Excel, when connecting to a Power BI Dataset you can modify some properties of that connection that is not available in Power BI.
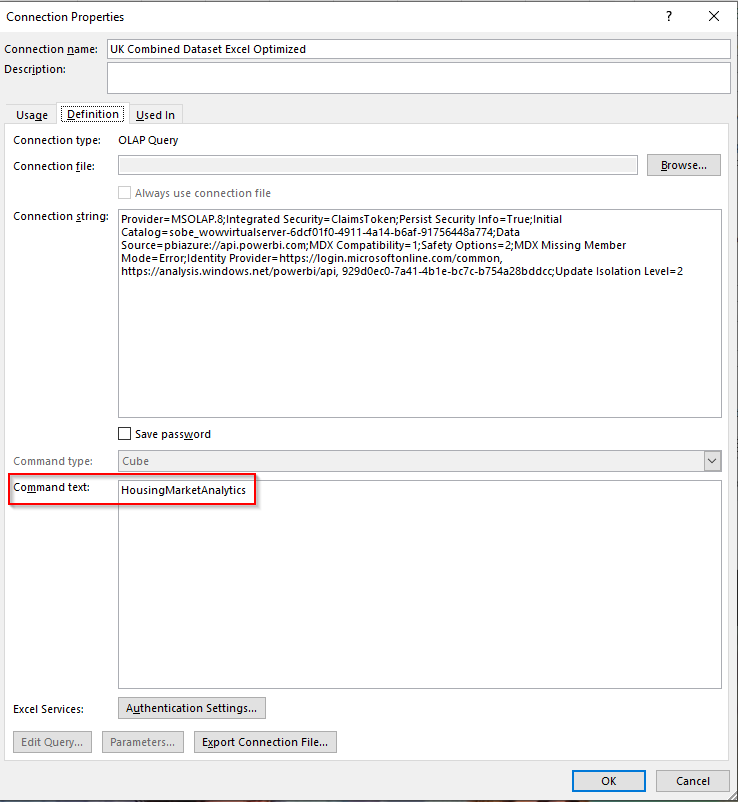
By opening the connection properties and navigating to the Definition section you can define the perspective you would like to use.

Tip: The Perspective name cannot have spaces in it.

Once you defined it, in the pivot table you will only see the tables, columns and measures that are added to that perspective. This can greatly simplify the work of an analyst because they do not need to spend so much time finding the pin in the haystack.

Creating a perspective connection file?
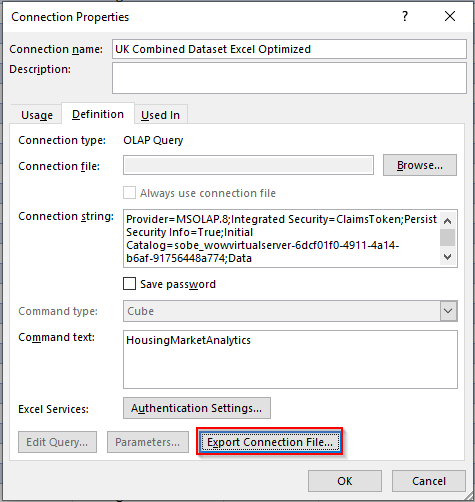
You can export the connection into a connection file and this property will be saved.

Summary
Perspectives are a really fantastic way to create different simpler views from a complex data model without the need to split it up. This helps both the Power BI developer and the end users.
Hope you liked this blog post, see you in the next one!
