Undocumented Features: Analytics for measures not visible
As I work with Power BI sometimes I encounter strange behaviours that I not heard before, and sometimes feel unintentional by the developers. I have to be honest I am not sure it is not documented, I just did not found it.
The first one I would like to write about is how to use the analytics features on measures that are not visible in the visual.
I posted about analytics features of visuals on this blog post.
Compared to the overall business
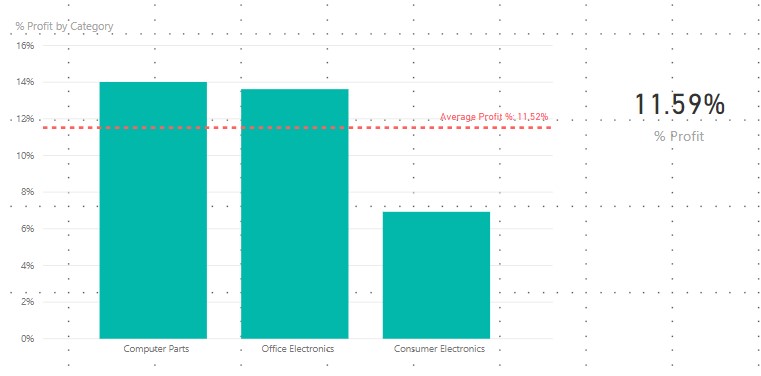
In this example I
would like to analyse the profit %
achieved by different parts of the business, compared to the overall business.
I chose the product
category as dimension first. In order the get a better view how it compares to
the overall values I used the analytics pane to show the average profit %.

If I drag the same
measure in a card visual next to it we already see that using the average in
not showing the same result.
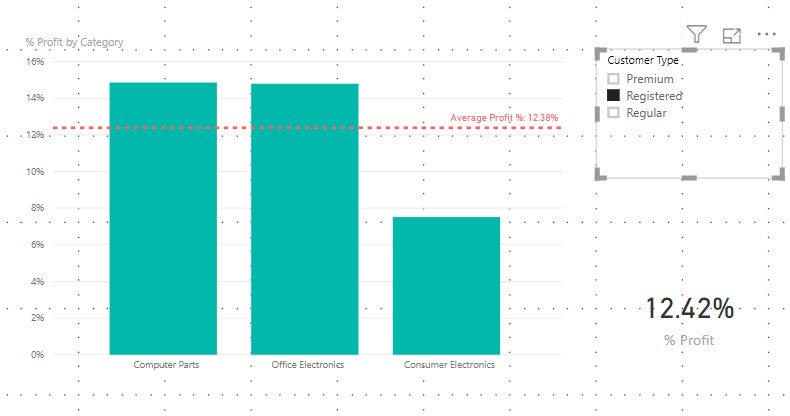
Showing a filtered result

In addition, when I use another filter on the visual, than it becomes obvious that we need to find a different solution to show the overall % value regardless of the filters on the visual.
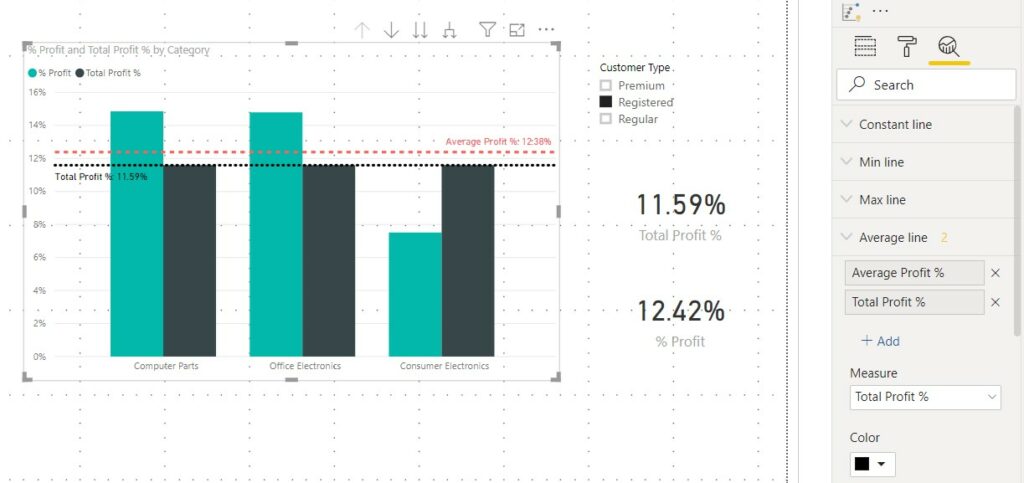
I want to make sure that the analytics line always show 11,59%. For that I need to create a new measure:
Total Profit % = CALCULATE([% Profit], all(Orders))
Orders is my fact table. By ignoring the filter on the fact table, makes sure that any filter coming from any dimension will be ignored.
Adding the measure in the visual will enable me to show an average line.

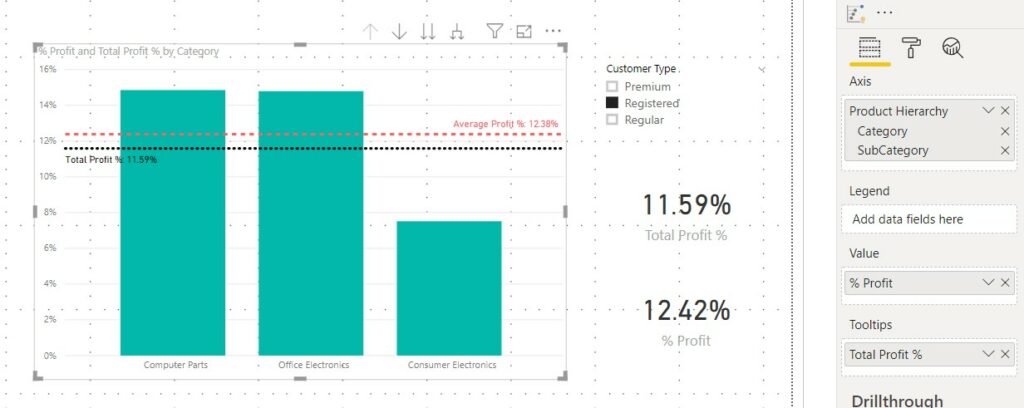
But, I really don`t like to see the total % number as part of the visual, I would only want to see the line, so I can move the measure in the Tooltips, but the Analytics Average line will stay.

It gets trickier, if we have RLS in our model. I will post about that shortly.
Hope you liked today`s post.


