How to be truly self-service
Learn what self-service means to me as a data analyst.
Note: This post will contain a lot of subjective opinion based on my experience.
What does it mean to be truly self-service?
It is not an easy question to answer.
So let's define what I think self-service means.
For me it means that I don't have to ask for help from anyone to get the results I want.
Why is this so important?

Time!!!
Time to insight. That is the most important metric a Data Analyst/BI Team can measure.
Let me break it down.
Think about it. Why we are spending endless hours to create one report after the other? The main reason is to help ourselves or others to decide which direction to guide our organization.
But how much time is spent on the actual decision making? Just narrow it down to one person looking at our report and making a decision. What do you think?
1 second, 10 seconds, a minute, maybe an hour? Of course it depends on the complexity of the decision and the way the information is presented. So, what is all the other time spent on?
Let`s time travel back from the actual decision making to the time the question was asked.
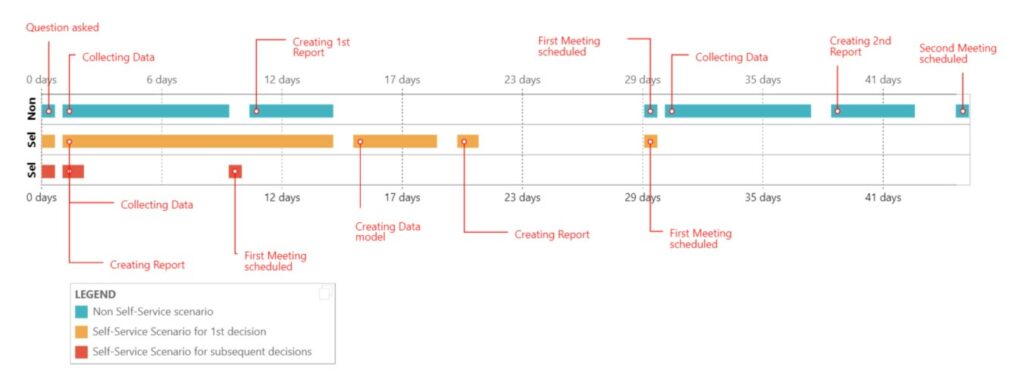
Step 1: Decision makers evaluating results/findings
A series of meetings occur to discuss the findings of the report.
Decision makers participate in the meeting, where they discuss which direction is right.
How long does this take?
If there is only 1 decision maker present, 30 minutes - 1 hour
Or, if he/she asks for clarification/modification/brings up new questions, then more meetings are scheduled, so a few more weeks.
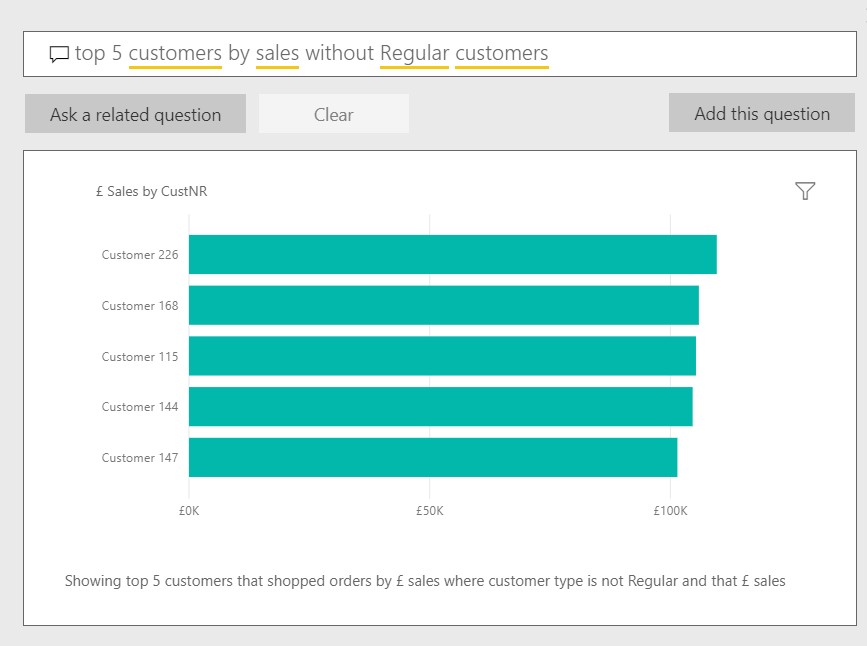
If there are multiple decision makers, then the decision by default requires more time, more questions, more subsequent meetings.
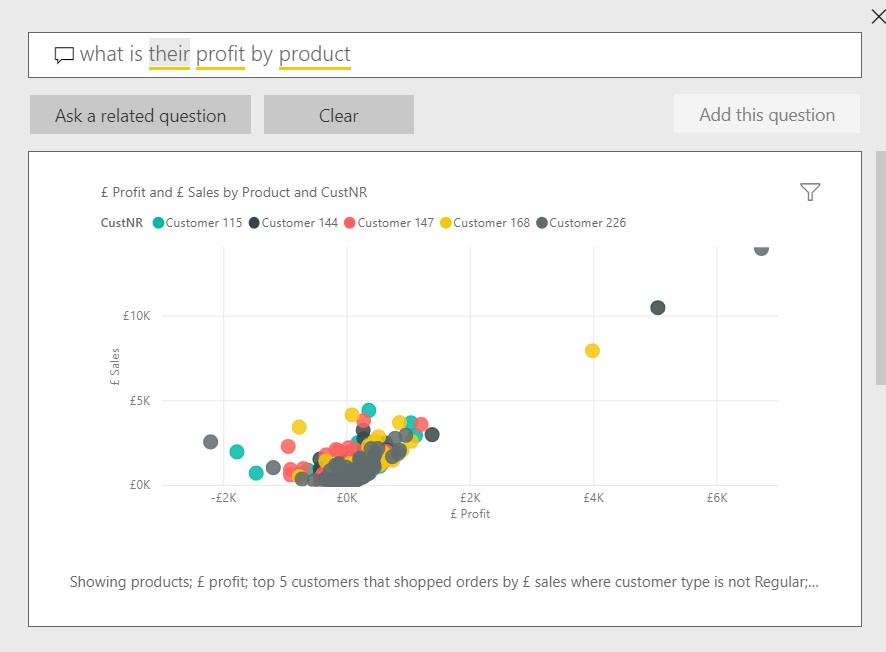
This is the first place where we can save time if the decision makers are able to self-serve themselves.
If you can interact with the report to see every angle of the decision, the effect of the decision, and you can easily ask questions from the data on the fly, then you can reduce the possible multi-week, multi-meeting process down to just one 1 hour session where everyone feels comfortable with the decision that was made because all their questions were answered!
Step 2: Creating the reports
If you are responsible for certain reports, for example financial reporting, you most likely create reports answering questions from the same domain.
So you have a defined set of data you work with.
Creating these reports takes time, even if you have access to all the data. You constantly have to redo steps and re-calculate metrics, which requires skill.
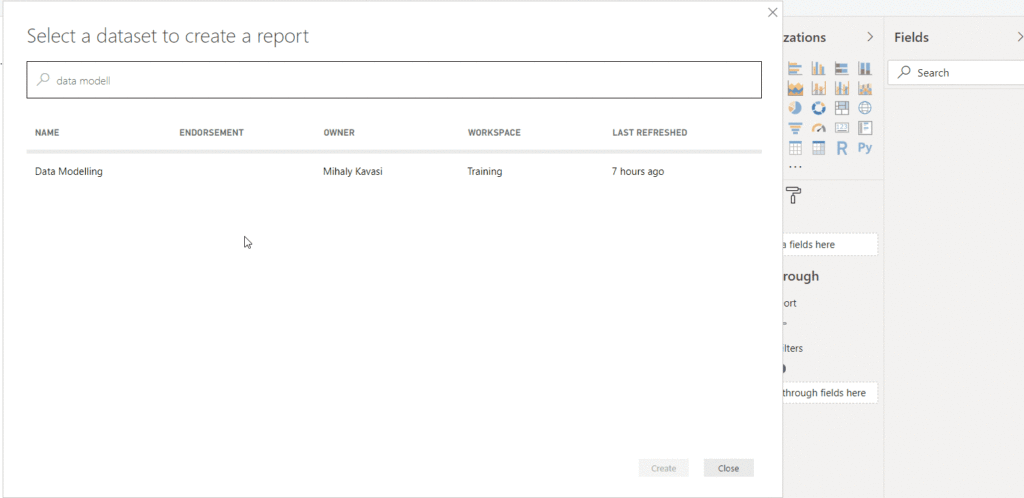
So you might need to rely on more tech savvy people to create some or all the reports for you.
This can take days or even weeks, and if you have recurring reports, this can take up most of a data analyst's time, so they won`t have time to actually analyse the data and come up with important insights.
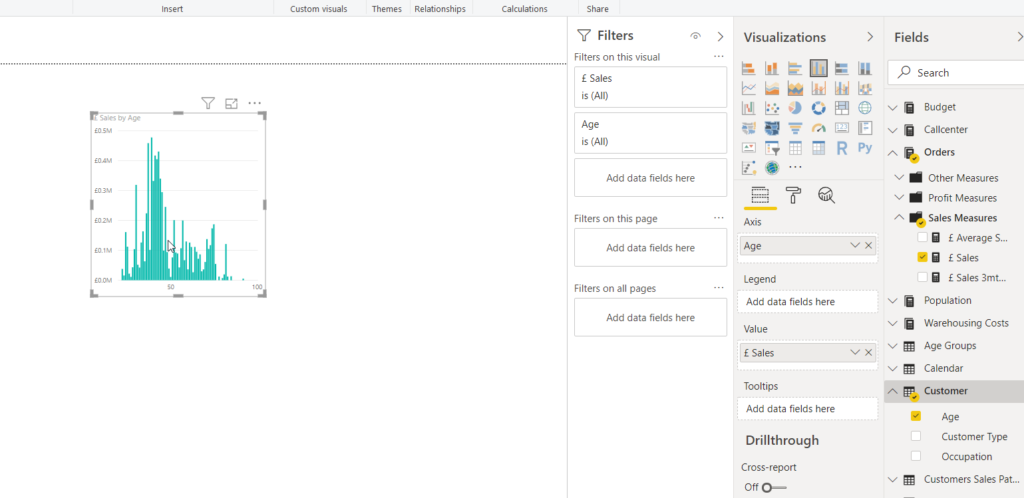
This is where the data analyst can save time if they can self-serve themselves.
If you can build or have an already built model, that was designed in a way to answer most (if not all) of the possible questions from a domain, then you can reuse that model to create and update various reports quickly without anyone else's help.
Step 3: Collecting data
This is what takes most of the time.
Get access to data sources, validate the data, clean and transform the data, combine with other data sources. Repeat.
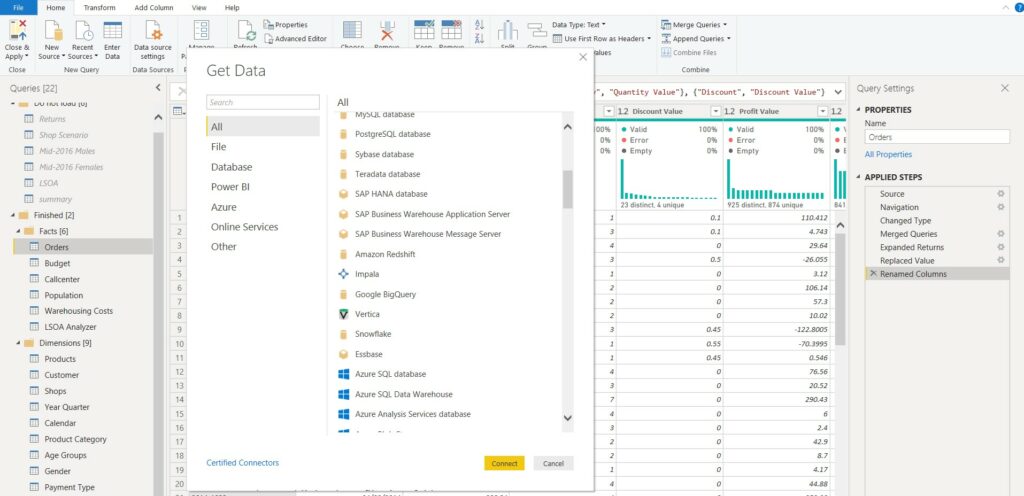
This part typically consumes 80% of a data analyst's time.
I hear these examples all the time during my training sessions:
"It takes 20 people 10 days to put together this Quarterly Management Pack"
"This weekly report takes up my entire Friday every week."
"I never have time to actually look into the data, because by the time I am finished with this report another deadline is approaching."
"I am not sure the reports we produce are actually accurate, because the guy who created the Excel with a bunch of macros are long gone and no one dare to touch it."
"I'm constantly creating the same reports every week, I am quite fed up with it."
Regular recurring topics in Power BI trainings
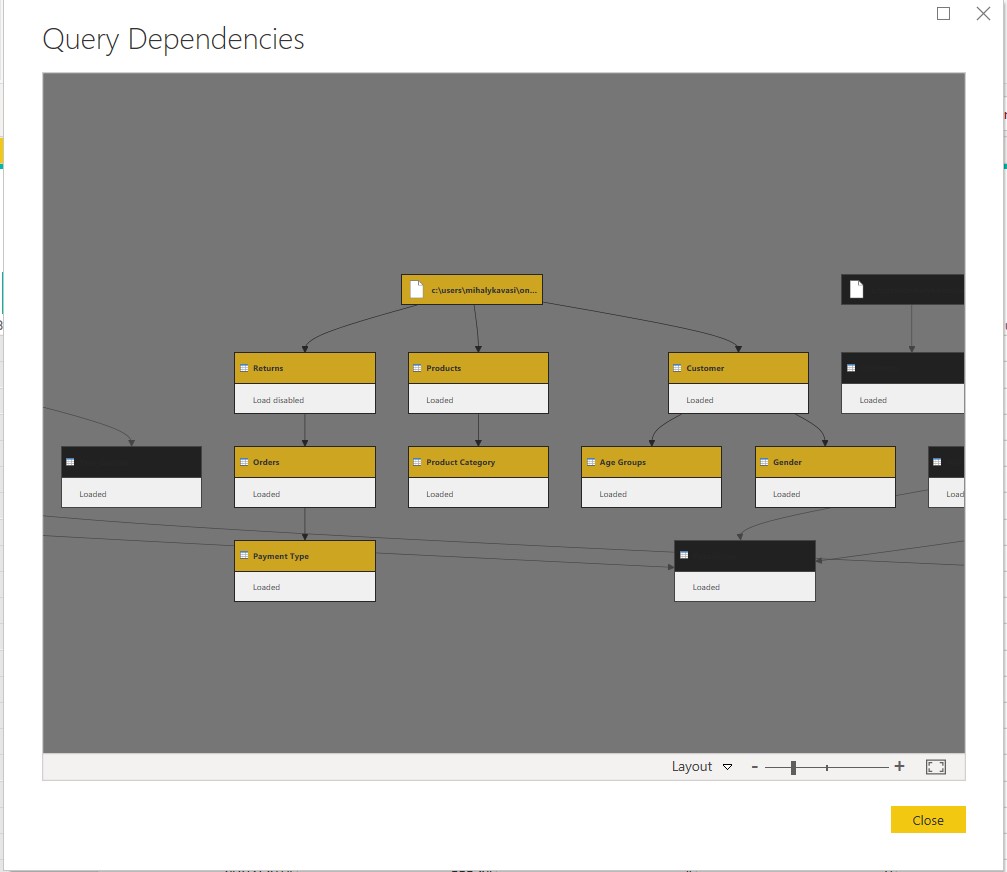
At this point you likely can't avoid involving your IT/BI team, but do it once and it will be reusable many times over. It's worth it!
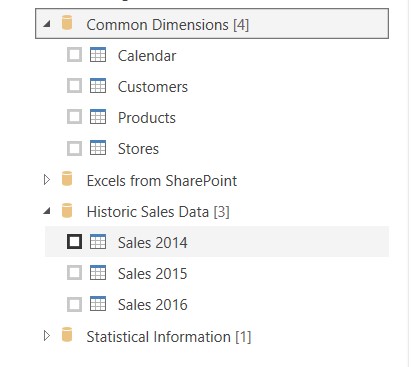
This is where a data analyst working together with IT could greatly improve their productivity.
If you can collaborate on creating cleaned, transformed, standardized, validated and refreshable data sources, you can greatly speed up the process of building new data models. What a relief that would be!
I hope you've enjoyed this blog post. My next posts talks about different levels of self-service in Power BI to showcase how it can help unlock all the value from the data quicker.


