
Pinning to dashboard - How it works
When we create dashboards from reports, it is a quite an easy task. Just use the Pin Visuals icon. But under the hood this has some cool functionality that might not be visible at first glance.
I will use an example to demonstrate this.
In the imaginary company where I work as a data analyst, I was tasked to create a commercial report. Now I want to create a commercial dashboard from the report I created.
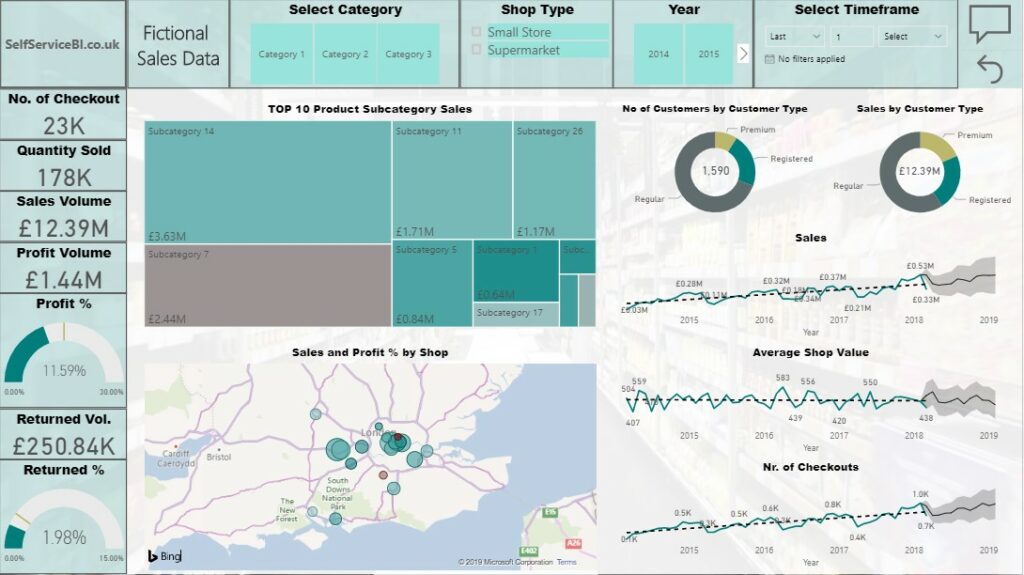
I want to involve decision makers to find the most important insights for them to focus on.
Pinning a filtered visual
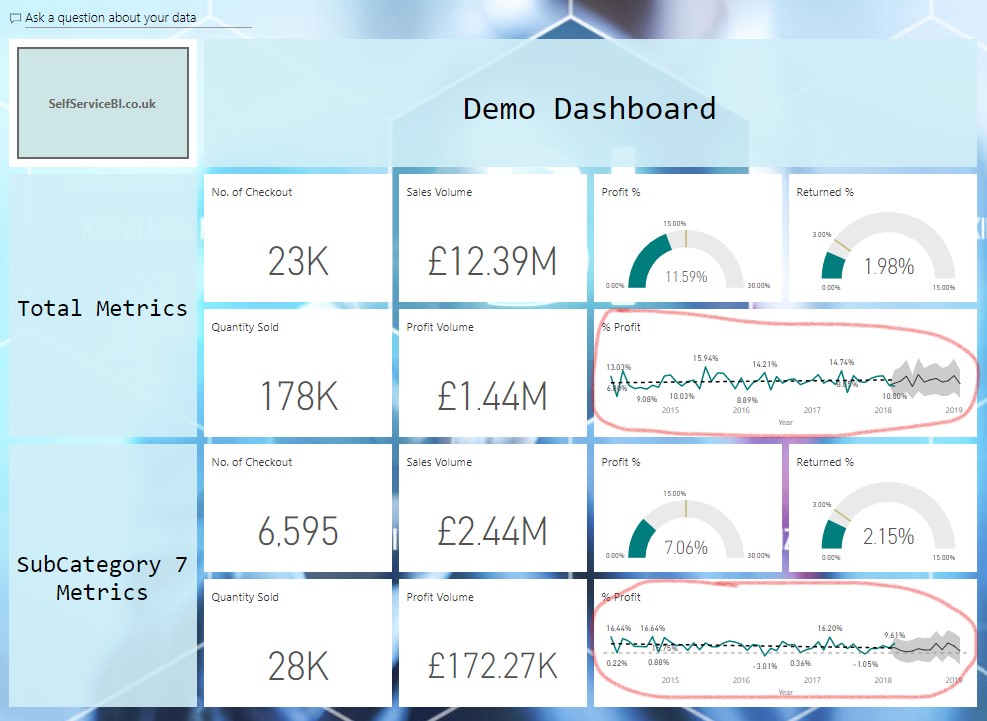
As we went through the report with the decision makers, they spotted that one product subcategory is producing worse results compared to the others. So, they decided that for the next quarter, they want to focus on this subcategory.
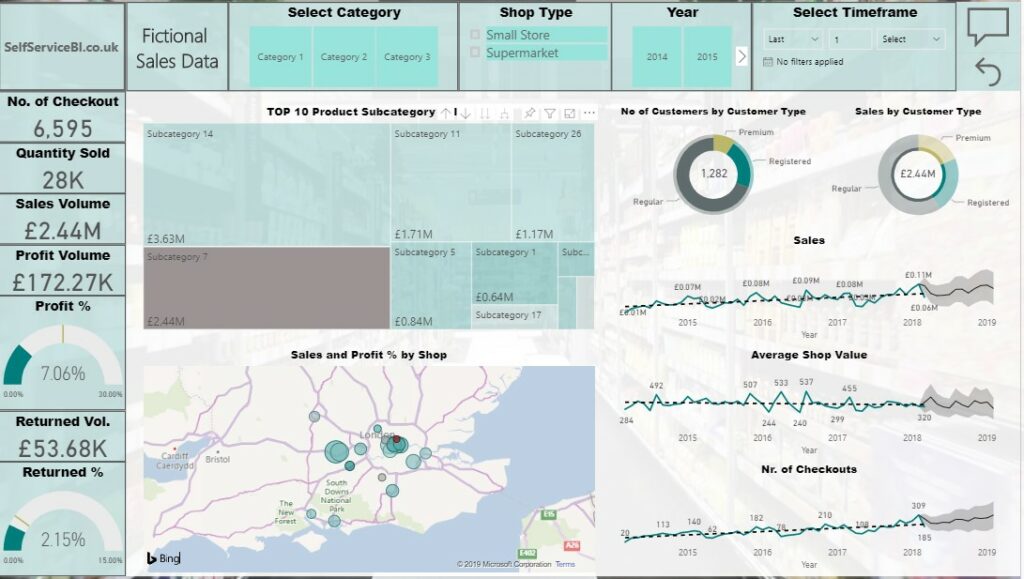
We can solve this requirement without adding a new page filtered to the subcategory by clicking on the filter and then pinning the visual on to the dashboard. The tile will remain filtered even after our report is not.
Pinning visual that isn't visible
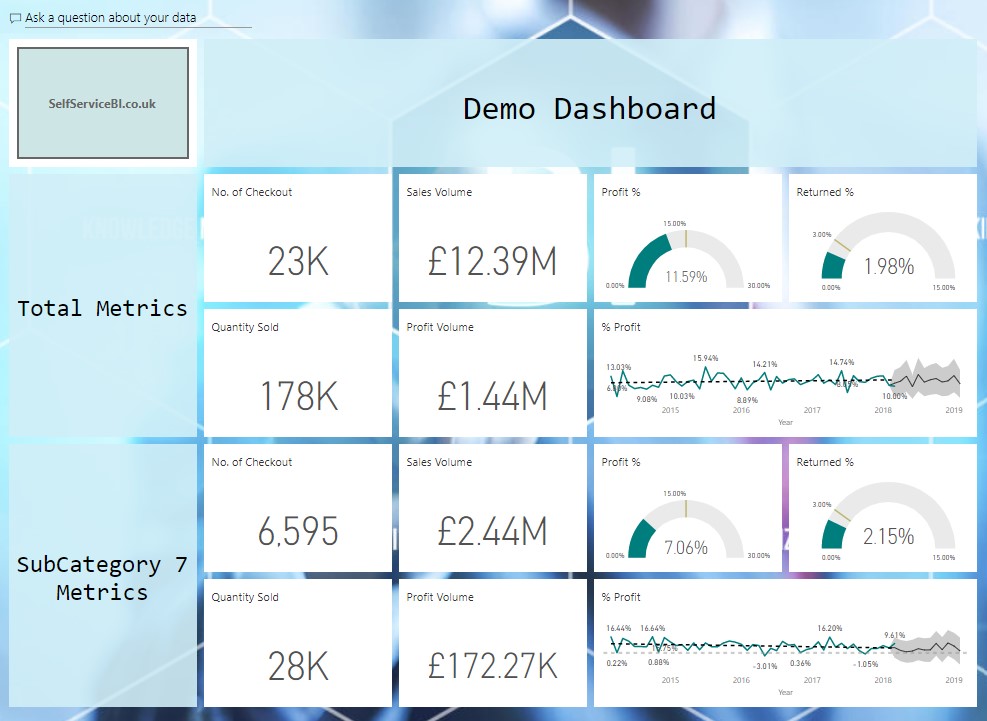
Secondly, the decision makers wanted to see in the dashboard how the Profit % changed over time.
This was not a requirement for the report and there is no more space to add it, but we can still solve it.
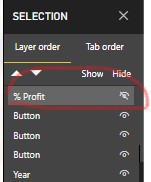
We can create the visual in the page, pin it and then hide it in the Selection Pane.
In the dashboard it will remain visible even if it is not in the report.
Pinning different versions of a visual
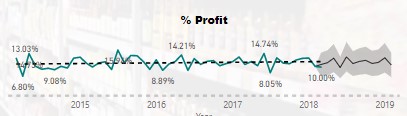
The filtered version of the Profit % goes under 0% a few times. It is hard to see when this happen, so it would be beneficial to see a 0 line. We can go back to the report and add a constant line, pin it and have 2 different versions of the visual in your dashboard.
Conclusion
To sum up, when you pin a visual, it is not a live connection between the visual in the report and the tile in the dashboard. Pinning takes a snapshot of the current state of the report visual and saves it to the dashboard.
Hope you like this short blog post.

