
Difference between creating a dataset for yourself or creating for others
When I began working with Power BI, all the datasets I created were intended to support the reports I was building. However, as more of my colleagues started embracing Power BI, they also wanted to create their own reports. Despite sharing the datasets with them, they often ended up not using them, even though the datasets contained all the information they needed.
I began to realize that what they saw in my datasets wasn't something that could help them achieve their goals faster, but rather a complex arrangement that they needed to decipher before they could start creating their reports. It was simpler for them to start from scratch and build their own datasets.
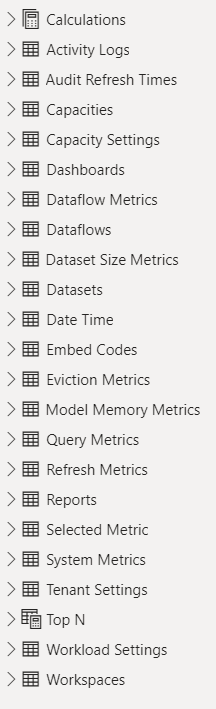
Initially, I didn't see any problems with my datasets because I was the one creating them. I had performed all the transformations, renaming, aggregations, filters, establishing relationships, creating bridge tables, calculations, and so on, so it was easy for me to understand them. I knew all the potential issues, which measures worked with which dimensions, and so forth. However, for my colleagues, it was just a confusing mess.
With the addition of Personalized visuals, which enables end users to modify the visuals in a report without been an author, the quality and usability of the datasets became much more important than ever.
Why is this important?
Datasets in Power BI contain a most important part of any analytics solution. The data model with the calculations.
The ability to reuse datasets is one of the key ways to eliminate unnecessary duplications of effort and data. It also helps you get closer to achieve a single source of truth.
One good dataset can be a source of 10s or even 100s of reports. If you think about maintenance and change management than it is obvious why having a smaller number of good quality, optimized and clean datasets is better.
Ideas to improve the data model
- Make column names easy to understands and use business lingo
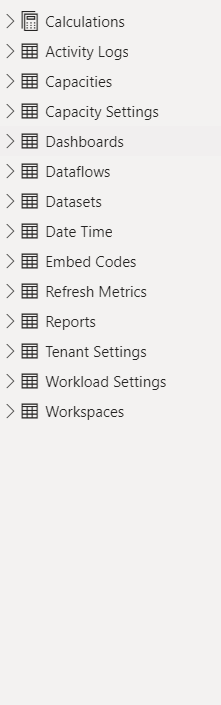
- Hide unnecessary columns, measures, and tables
- Organize columns and measures with folders
- Provide descriptions to measures (add the DAX formula at least) and columns that need explanation
- Make sure that additional filters are not needed to display the right values using a measure. For example, the need to filter out returned sales in the visual filter to give you the proper sales volume, have a measure that already provides that
- Create Layouts for each Fact table in the Model view
Conclusion
If you think your data model will be used by someone other than you, make sure it is as easy to use as you can possibly make it.
The ability to reuse datasets is one of the most under used feature of Power BI.

