
Slicers or Filters - Comprehensive Guide
Slicer and filter were around in Power BI for a long time now, and plenty of blog posts were created comparing them to each other. Because these features constantly get updated and there are considerations outside of just a single report, I thought to write a comprehensive guide that I can point to every time this question comes up.
And this comes up a lot of time even now, when a discussing report design principles and best practices.
So, should be use Slicers or Filters in our Power BI reports?
It is not a simple decision because there are a lot of reasons to choose either of them. Or is it really a choice we need to make?
Note: This topic requires basic knowledge on how slicers and filters workWhy does it matter? Why would you want to choose?
One main reason you would want to decide is that by providing consistent way consumer can interact with your reports helps them learn new reports easier. That helps adoption. This way if they learn one report, they learn all! This is extremely important if you have multiple teams designing report that is used by the same/similar audiance.
Using slicer or filters does not seem that important when you only think about one report, but when you have to decide for potentially hundreds of reports and hundreds of consumers than it suddenly becomes important.
Having seen inconsistent design patterns and spoken with consumers about the problems it causes, made me realize that this is an important topic.
Feature overview
I tried to collect and evaluate certain capabilities that are important in reporting, which can help you in this decision.
| Features | Slicer | Filter |
|---|---|---|
| 1. Filter options | ✓ | ✓* |
| 2. Partial filtering | ✓ | |
| 3. Brand integration | ✓ | ✓ |
| 4. Synchronization | ✓ | |
| 5. Real estate usage | ✓* | ✓ |
| 6. Hierarchies | ✓ | |
| 7. Empty result set | ✓ | |
| 8. Top N filter | ✓ | |
| 9. Parameters | ✓ | |
| 10. Data cleansing/Permanent filtering | ✓* | ✓ |
You will see that some use cases will require one or the other feature. Sometimes both.
1. Filter options
The first feature we going to examine is the filter options available. This is one of the important deciding factors between slicers and filters.
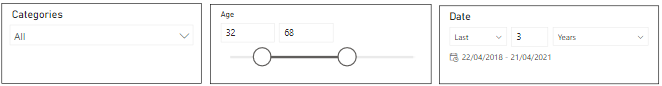
Slicers options:
| Text | Number | Date |
|---|---|---|
| List | List | List |
| Dropdown | Dropdown | Dropdown |
| Between | Between | |
| Less than or equal to | Before | |
| Greater than or equal to | After | |
| Relative Date | ||
| Relative Time |
" height="105">
You can also enable search or create a button like appearance. There are custom slicer visuals that can be really useful. Also, you can control if they are single select, multi select or multiselect with control.
Tip: Just learned if you can control the visibility of the search bar using CTRL + F, but the report creator needs to turn search on first.
Filter options:
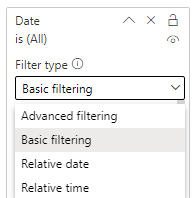
Basic filtering which is like list multi select in slicers. It has require single select option but it does not have the same capability as the similar slicer option.
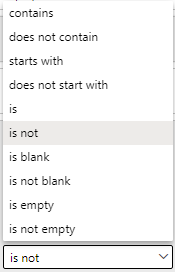
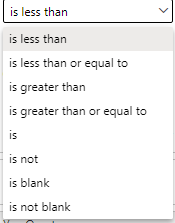
Advanced filtering capabilities are similar to Excel's number/text filters. The options will change based on the data type of the column.
"wp-image-708">
"wp-image-709">
Relative date and time: gives you filtering capabilities based on current date and time.
As you can see filters also give you lot of options as well but are missing some key features.
- sliders,
- forced single select
Update:
Marcus Wegener shared with me another great idea how to expand the capabilities of Advanced Filtering in the filter pane by enabling selection of more than two values. Here it is:
2. Partial filtering (within a page)
In some cases, you want to be able to filter only some of the visuals on a given report page.
In the Filter Pane you can either do a filter on a whole page or on a given visual. This is usually not flexible enough in these use cases.
"wp-image-700">
Slicers give you the ability using Edit Interactions to selectively affect visuals on your page.
"wp-image-603">
3. Brand Integration
Both slicers and the filter pane can fully integrate with your branding. With slicers you can also use pictures like brand logos or product images.

"wp-image-604">
4. Synchronization
Filter synchronization between pages can also be very important factor. The users prefer to set the context (filters) once and used that to analyze the data.
Filter Pane
In the filter pane you have 2 options:
- Filter all pages
- Filter one page
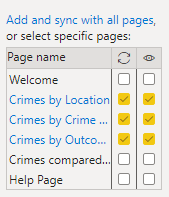
Slicer
With the sync slicer option, you can fully customize the interaction between report pages for each slicer.
Synchronization can be one way or both ways and you can also control visibility separately.
"wp-image-702">
5. Real estate usage
One important aspect is how much space they take up from the available real estate.
Filter pane is totally separated from the report area and can be closed.
Tip: you can also hide the filter pane if you don`t want your users to use it. Filters setup there will still affect the report.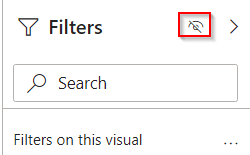
"wp-image-519">
Slicers on the other hand generally consume report real estate. There are techniques to create "pop-up" slicer panels. Here is one example by Mara Pereira: https://www.datapears.com/post/how-to-build-a-customised-filter-pane-in-power-bi
Also, with slicers you can create a dedicated filter/slicer page and just use the sync slicer functionality with hidden slicers to apply them to other pages without taking up any real estate.
6. Hierarchy
This is a really valuable feature if you want to narrow down the list you want to find what you are looking for. This helps organize the options and guides the users. This is only available for slicers currently. Previously only custom visuals had this functionality, but it was added to the default slicers some time ago.
"wp-image-715">
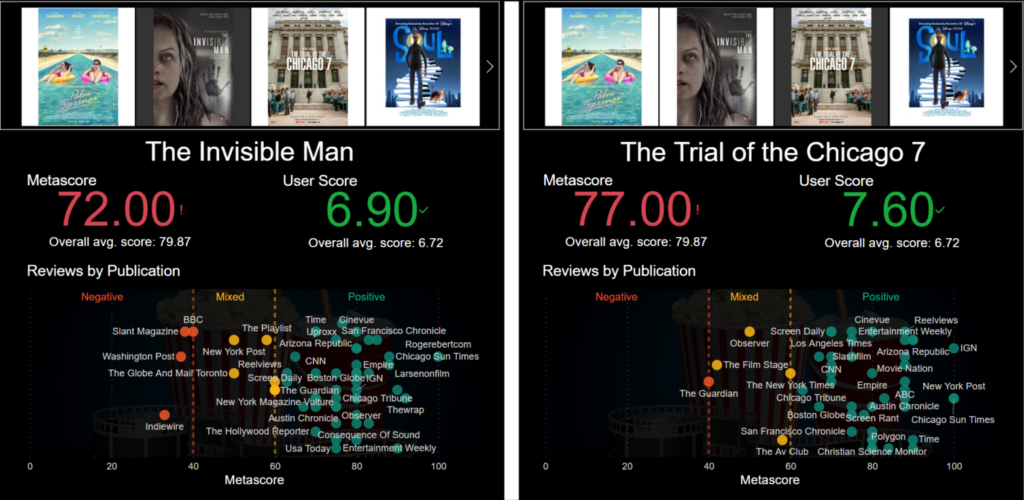
7. Empty result set
This is a technical term for no data is available based on the combination of your filter selections (context).
"wp-image-716">
This feature requires a bit of problem and solution requires a bit of explanation. For that we turn to the data model.
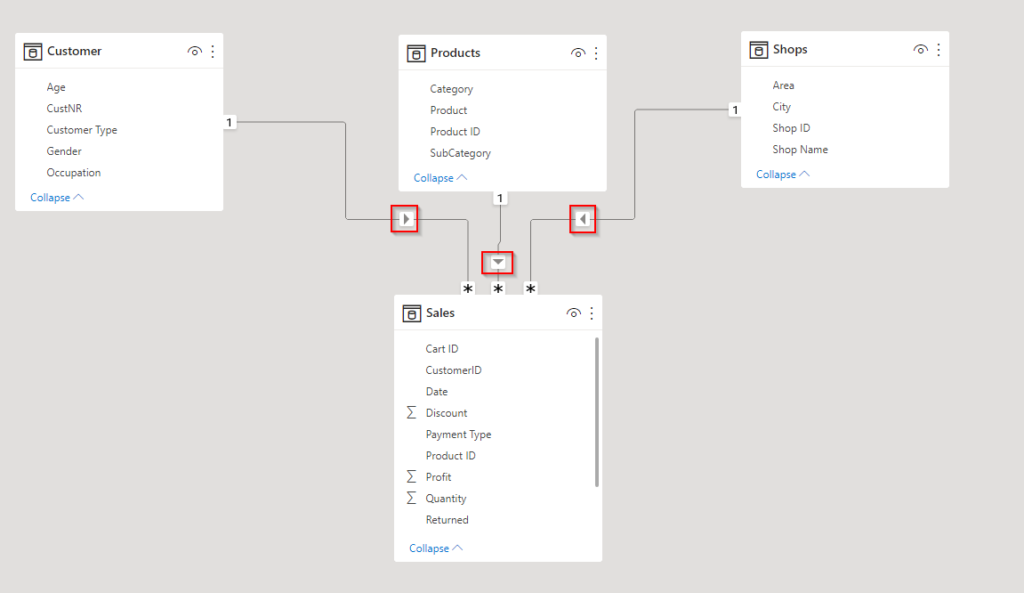
"wp-image-717">
This is a classic example of the star schema. You can learn about star schemas HERE.
The problem is the dimensions, where the slicers are from, cannot filter each other. Therefore, creating a possibility of an empty result set.
How can we solve it? With filters for slicers. ?
You can use measures as filters in the slicers visual level filters. Here are used a simple row count measure on the Fact table.
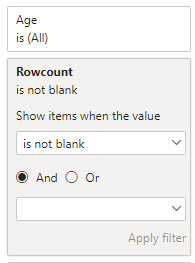
"wp-image-719">
This will ensure that only those slicer values will be displayed that have rows associated with them in the fact table.
"wp-image-720">
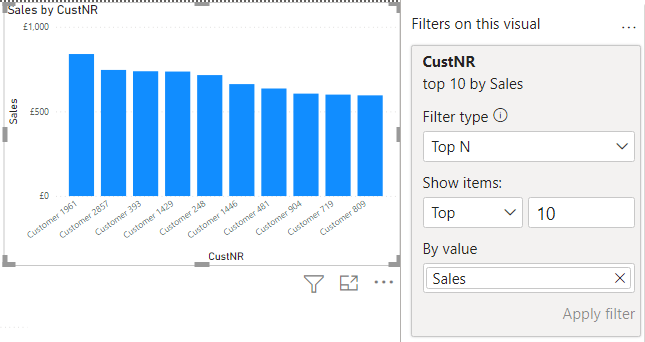
8. Top N filter
This is a special capability that is only available for the visual level filter in the filter pane.
If you want to display for example the TOP 10 customer by sales, then instead of writing this logic in DAX you can just simply use this TOP N filter type for your visual.
"wp-image-520">
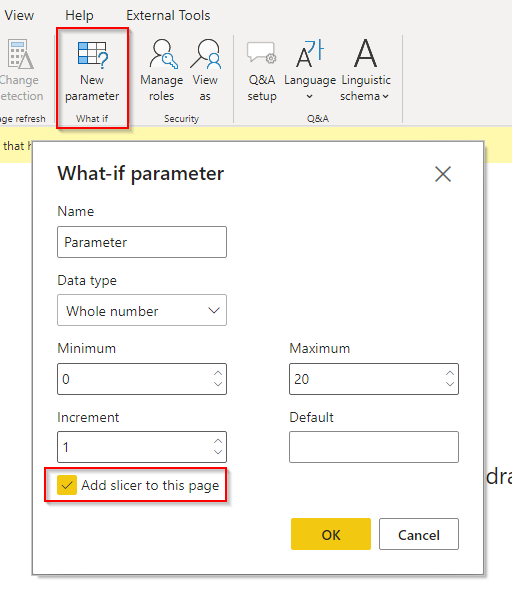
9. Parameters
If you would like to do some what-if analysis than parameters are a way to create an input for those scenarios. When you create a parameter, you will have an option to add a slicer to the page.
"wp-image-697">
"wp-image-699">
Note: it is possible to use the parameters in filters, but the lack of proper single select support can easily confuse the end users.10. Data cleansing/Permanent filters
In slicers there are no ability to prevent users to change the selected value apart from hiding the slicer itself.
In filters you can chose to lock a filter or even hide it. This way you can specify a certain page to show a subset of the data or to filter out data errors that are still present in the data like RI violations.
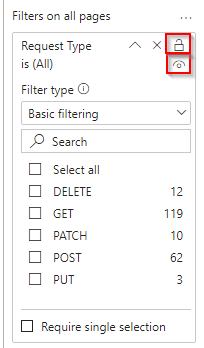
"wp-image-690">
Important note that if you hide the filter then the end users won`t be aware that filter is active. This might be desirable in certain occasions, but generally I would recommend against using it in production reports. Users should have the full context on what insights they are getting.
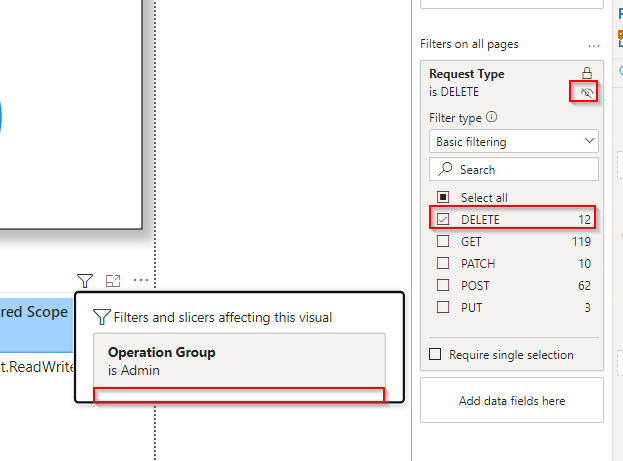
"wp-image-691">
Tip: did you now that hidden slicers are still filtering the visuals?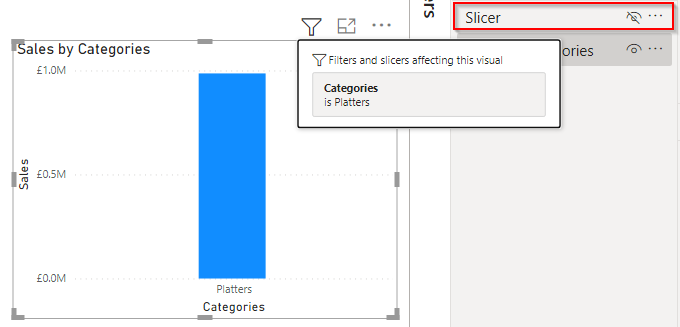
"wp-image-517">
Summary
It is not an easy decision because both slicers and filters have some unique advantages in certain scenarios. Creating guidelines on their usage for your organization however can go a long way helping creator and consumer adoption in Power BI.

