
What are the options when a Power BI report is slow? - Power BI Performance Guide
This blog post want to help how to understand the reasons and give you a starting point for improvements in Power BI report performance. Won't cover all the options in-depth instead will point you to a useful youtube video, blog post or tool.
It is not a comprehensive list but I hope it gives you a good starting point and view of the options.
Let's start
First establish what part of the report is slow?
Mainly it is either the visualizing or refreshing the data. In Direct Query both happens the same time.
Let's talk about of them separately:
Report visualization is slow
When you click on a visual or even when you open the report it takes a long time for the visualizations to appear.
What "slow" means?
The easiest answer is what the user feels as slow.
There were some studies made about this generally for applications: https://www.nngroup.com/articles/response-times-3-important-limits/
It sets 3 limits:
- 0.1 sec - reacting instantaneously
- 1 sec - user's flow of thought
- 10 sec - keeping the user's attention
My experience is that under 3 seconds is generally acceptable for report consumers, but there were expectations of sub-second response times..
There are some general recommendations in the Power BI Documentation that you can start to explore:
https://docs.microsoft.com/en-us/power-bi/guidance/power-bi-optimization
Analyzing Performance
The first principle is that you cannot fix something you don't measure first. Last year the Performance Analyzer was introduced to help debug your reports
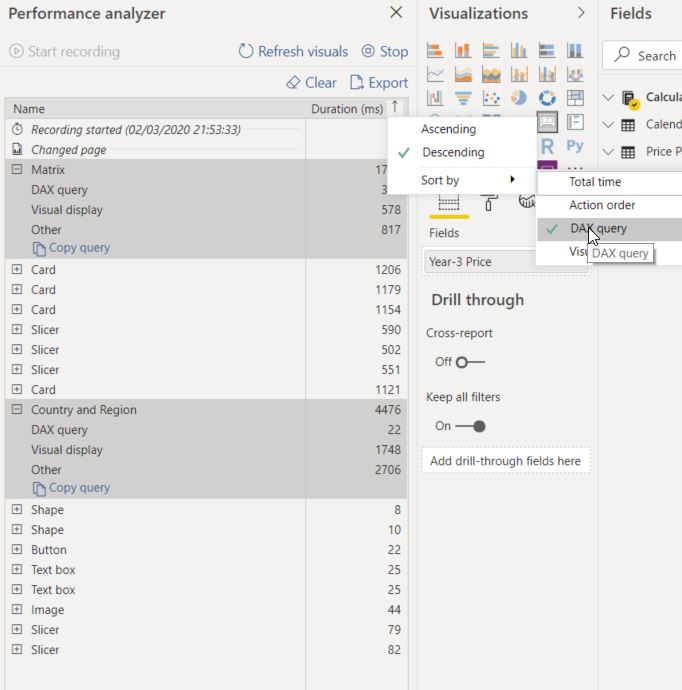
Here you can see the time it takes to render each visual in your report page. Performance Analyzer breaks it down to DAX Query, Visual display and Other.
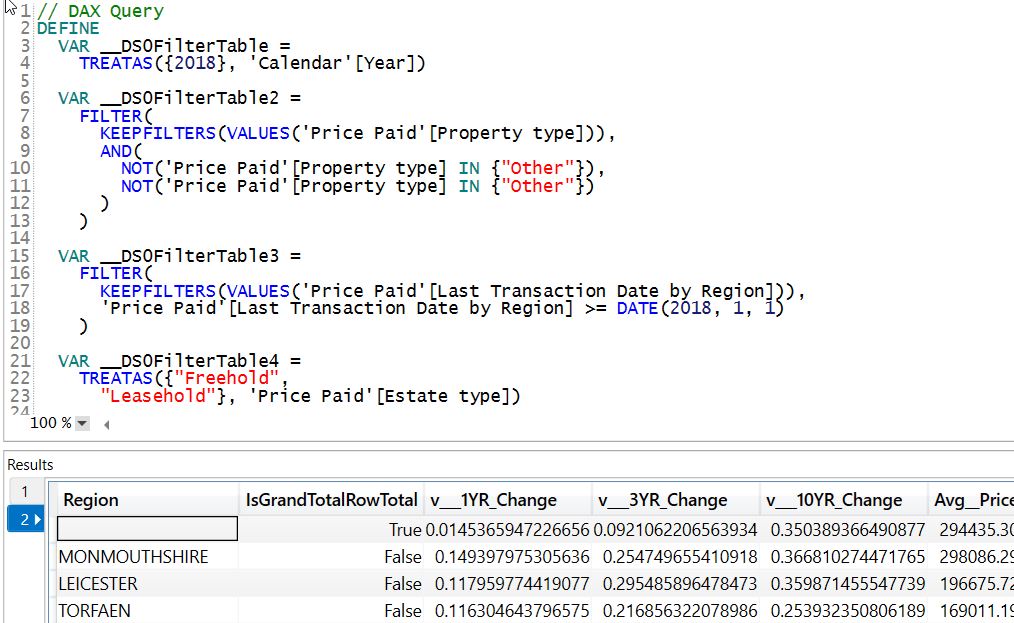
If you want more detail you can export the result, put it into DAX Studio to see the DAX Query your visual generates.
Further Reading:
https://docs.microsoft.com/en-us/power-bi/desktop-performance-analyzer
https://www.sqlbi.com/articles/introducing-the-power-bi-performance-analyzer/
Visual optimization
As you saw previously every visual in your report page generates a query. So it is useful to look at ways to reduce the number or the complexity of the queries your report generates.
The following blog post talks about how a small change in visual display can have a big effect on the number of queries:
Important to understand that only visible visuals generate queries.
So separating you visualization into multiple pages or hiding some visualizations before some filter are applied.
DAX optimization
Data Analysis Expressions are a really rich and powerful language that enables you to extract all the value out of the data.
But it also can be really complex.
If you see that DAX takes up a lot of time in the performance analyzer, than its time to look into potential optimization possibilities.
First blog talks about how you can find which part of you DAX calculation is causing the problem using Variables:
Debug DAX using Variables in Power BI
This videos shows some optimization examples:
https://www.sqlbi.com/tv/power-bi-dax-optimization-examples/
Model optimization
Together with DAX you also need to look at your model.
There are a few important concepts for optimizing the model:
- Don't load in anything you won't use
- Make sure your facts and dimension are separated in a star schema
- Only use many-many relationship if you cannot avoid it in anyway
- Don't use bidirectional filtering just to quickly solve a measure or slicer issue.
The following video talks about some of these:
Here is the link to the Vertipaq Analyzer: https://www.sqlbi.com/tools/vertipaq-analyzer/
You can use the Power BI Cleaner tool to understand which columns are used in your report and what is the footprint of each column.
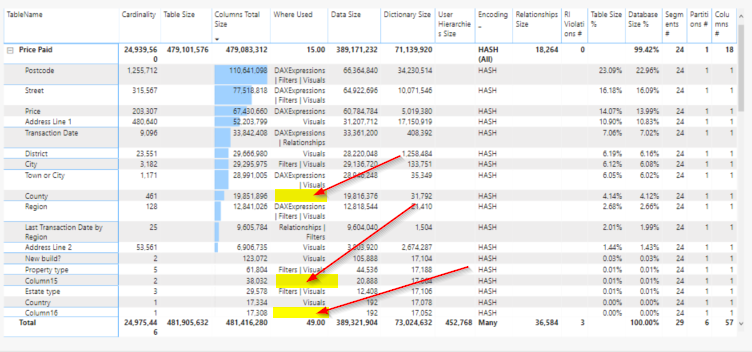
This blog post talks about how you can use it & the link to download it:
The Power BI Helper tool has similar features and also helps with the documentation.
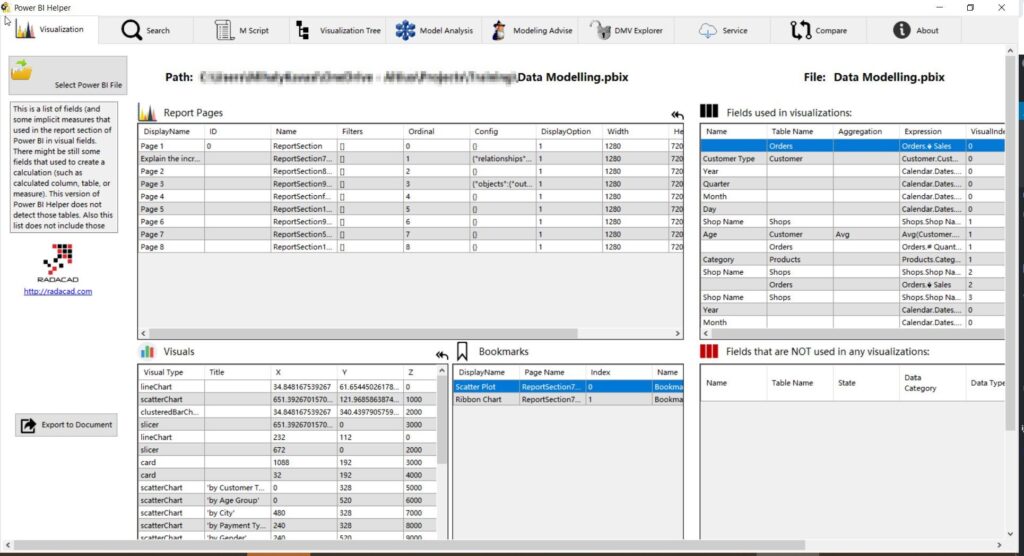
https://radacad.com/power-bi-helper
Splitting the model
If you cannot make your single data model performant enough than you can explore other options. One of those options could be to split the model into different parts, maybe different granularities.
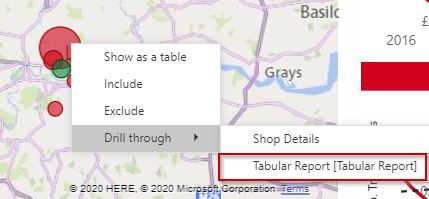
You can utilize the cross report filtering capability in Power BI to connect those reports together. Just make sure that both of the models use the same dimensions, so the filters can be passed through.
Cross-report Drillthrough in Power BI
Composite models & Aggregations
Another possibility to consider is composite models and Aggregations. It was designed to enable analyzing billion of rows of data.
Composite models enables you to have both import and direct query data sources in the same model.
Aggregations enables you to have 1 or more pre-aggregated facts next to the detailed fact table and let you set up the rules which one to use to maximize performance.
The next video by Alberto Ferrari talks about this capability in SSAS Tabular:
https://www.sqlbi.com/tv/optimizing-multi-billion-row-tables-in-tabular-sqlbits-2017/
Here you can read about composite models and aggregations in the docs:
https://docs.microsoft.com/en-us/power-bi/desktop-composite-models https://docs.microsoft.com/en-us/power-bi/desktop-aggregations
This video shows a detailed example of an aggregation model. Adam Saxton (Guy in a Cube) interviewing Christian Wade.
How to use the Power BI
Aggregations Feature
Row Level Security optimization
RLS can have a big effect on performance. It effects for example query caching in the service.
It is a good advice to test your report performance with and without RLS so you can measure the difference. Just make sure you are retrieving similar amount of data.
Premium Optimization
After we are comfortable with the performance of our report in the desktop we can look at the optimization possibilities in the service. Especially for Premium.
First we need the Premium Capacity Metrics added to our tenant.
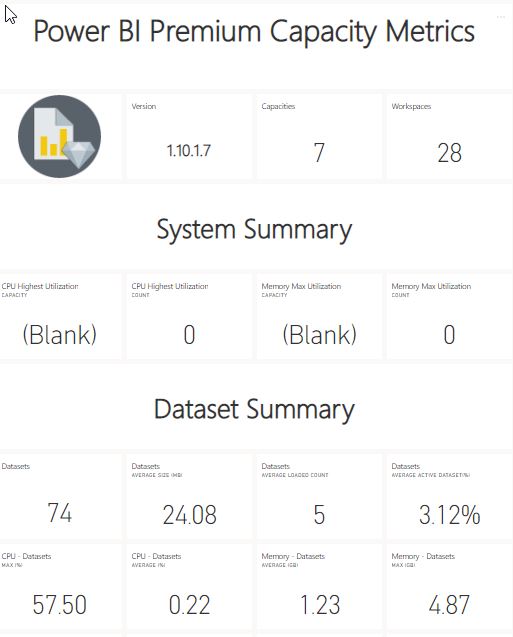
The first video is a general overview on how to plan your premium capacity
The next video is from Adam Saxton (Guy in a Cube) interviewing Josh Caplan about the Power BI Premium Capacity Metrics and try to answer the question of "How many users my capacity can handle?"
It contains lot of valuable insights in the background details of a Premium
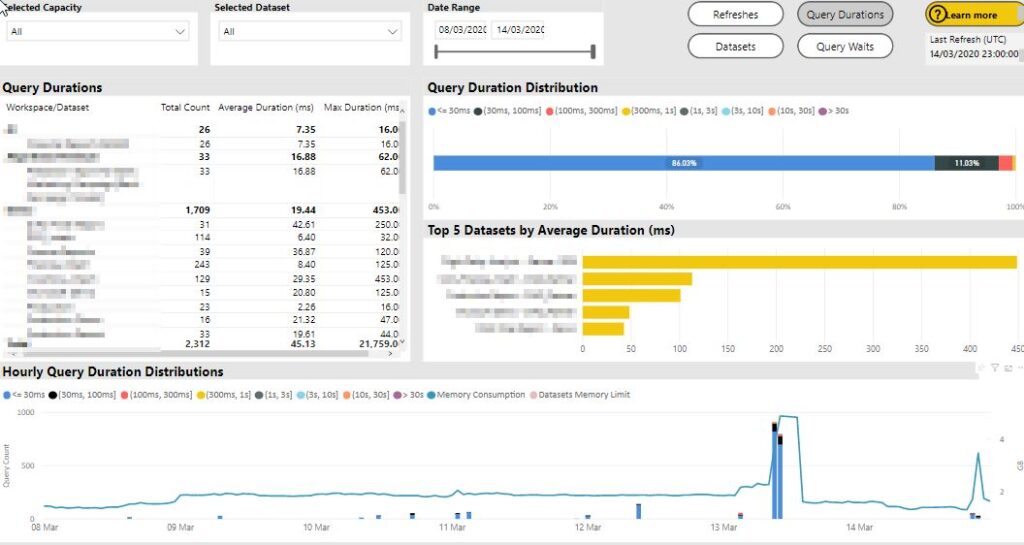
There is the optimization guide in the microsoft docs that is worth to read:
https://docs.microsoft.com/en-us/power-bi/service-premium-capacity-optimize
It that guide they talk about how you can load test your reports in the capacity
https://github.com/microsoft/PowerBI-Tools-For-Capacities/tree/master/LoadTestingPowerShellTool/
Microsoft introduced read XMLA endpoints. RW end-points are coming this year.
This enables to connect developer and management tools like visual studio, SSMS, Dax Studio and give access to the server behind the Premium capacity.
Radacad wrote about this in their blog:
https://radacad.com/what-is-the-xmla-endpoint-for-power-bi-and-why-should-i-care
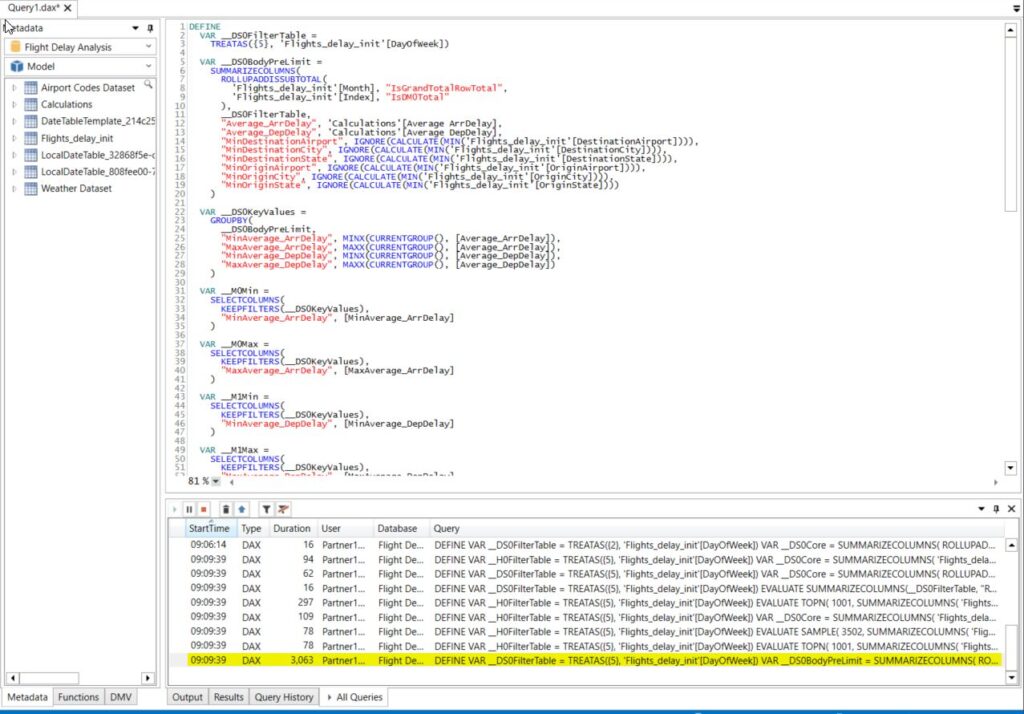
There is also a video that shows you how to connect DAX Studio or SQL Server Profiler to a Premium Capacity.
Testing in the browser
If you really want to understand your reports performance for the consumer you need to do testing in the browser instead of Power BI Desktop.
The reason is that the way Power BI renders the reports in the browser is different then in the desktop. Also the type of browser can have an effect on the perceived performance of the report.
Chris Webb did a very detailed 3 part series on how to test performance on the browsers:
Report Refreshing is slow
Other part to look at if the data refreshes. Even if you refresh times are not that important it can have an effect on the report consumption performance in Premium.
Analyzing Performance
Same as in Report optimization the first thing you have to do is to start measure the performance.
In the service you can check the refresh history of a dataset and see the amount of time a refresh took using the Rest API:
https://docs.microsoft.com/en-us/rest/api/power-bi/datasets/getrefreshhistoryingroup
Power Query Optimization
PowerBI's data preparation tool is robust so it can handle really inefficient queries. But the ripple effect of inefficient data preparation can be huge on the overall user experience.
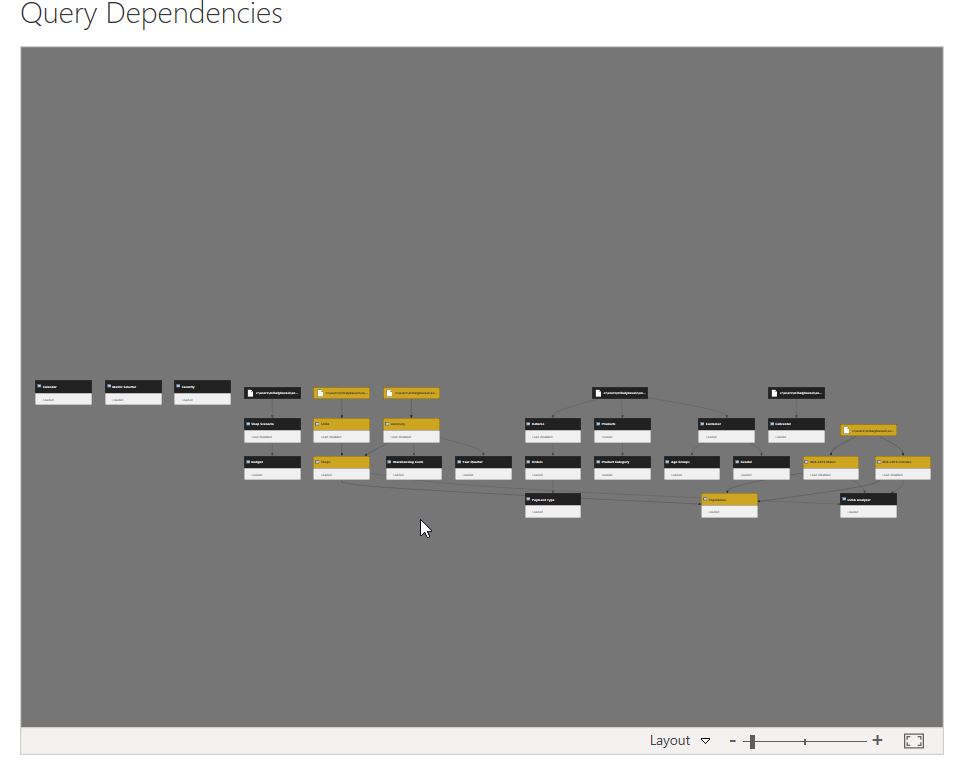
I found that complex Query Dependencies can be a huge contributor of slow refresh times.
Few tips and tricks:
- Do not load in any data (Row or Column) or table that is not needed in the model
- Delete unnecessary automatically created steps (like Changed Type or First rows as headers)
- Use Remove Other columns as soon as possible
- Don't use Sorting, they don't have an effect on the table loaded in
- Try to avoid errors rather then handle them.
- Try to find solutions to solve problems in 1 step rather then more (like use Text Before Delimiter instead of Split Column, Remove Column, Rename Column)
- Use merge as a dynamic filter to only load in necessary rows
- Make sure you maximize the effect of Query Folding when possible
https://docs.microsoft.com/en-gb/power-bi/guidance/power-query-folding
There are also a multi part series by Chris Webb on Power Query Optimization:
Gateway Optimization
For on-premises data sources the gateway is another factor you should consider. It has an even greater effect if you use Direct Query.
You can analyze performance by turning on additional query logging.
If you have both Import and Direct Query loads then separate them into different gateways on different machines.
The transformation steps that are not query folded will happen using the machines resources where the Gateway is installed, you need to make sure that the machine does not have other crucial resource intensive responsibilities.
Here are the details of monitoring and optimizing performance:
https://docs.microsoft.com/en-us/data-integration/gateway/service-gateway-performance
Data Flow Optimization
Dataflows are basically Power Query online. It runs in the service using Azure Data Lake as the storage engine. The performance of the queries can be sometimes different from the Desktop Power Query performance.
My recommendation is not to create any dataflows directly but as a Power Query in Desktop first. Then copy the code into a dataflow.
This way you can easily compare performance differences alongside other advantages.
There is a blog that show an example of that principle:
https://selfservicebi.co.uk/getting-files-folders-from-sharepoint-or-onedrive-in-dataflows/
Here is what you can find on Dataflows in the Docs:
https://docs.microsoft.com/en-gb/power-bi/service-dataflows-best-practices
Blog posts by Matthew Roche about Dataflows:
- https://ssbipolar.com/2019/10/12/power-bi-dataflows-and-query-folding/
- https://ssbipolar.com/2019/12/11/power-bite-dataflows-enhanced-compute-engine/
Scheduling Optimization
If you have a big reporting estate, having a scheduling strategy is quite important.
One recommendation is to avoid peak consumption times to do refreshes. Because if you refresh and consume a model at the same time that doubles the memory footprint of that model.
You could use the APIs to understand you current scheduling timelines.
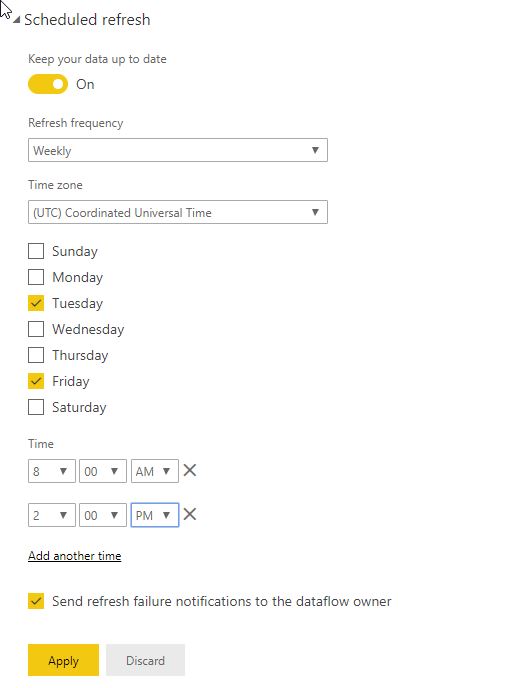
The scheduling options currently provided by the UI can be limiting. Like you can only schedule 2 different days with the same times. It would be good to have a matrix or table where we could pick half hour slots.
If you have a lot of scheduled refreshes then start considering a more agile approach using the Data Refresh API instead of the built-in scheduling.
- https://docs.microsoft.com/en-us/rest/api/power-bi/dataflows/refreshdataflow
- https://docs.microsoft.com/en-us/rest/api/power-bi/datasets/refreshdatasetingroup
- https://docs.microsoft.com/en-us/rest/api/power-bi/datasets/updatedirectqueryrefreshscheduleingroup
Summary
As you saw there are endless triggers you can pull to squeeze out a little more performance of your Power BI models and reports.
I would like to thank all the hard work that these experts put into sharing the knowledge with us:
- Guy in a Cube - Patrick LeBlanc and Adam Saxton
- Crossjoin.co.uk - Chris Webb
- SQLBI.com - Marco Russo and Alberto Ferrari
- The BIccountant - Imke Feldmann
- Fourmoo - Gilbert Quevauvilliers
- Radacad - Reza Rad and Leila Etaati
- BI Polar - Matthew Roche
- And everyone how participated in the Power BI Docs
Please let me know if I left out anything important or I made any errors. I was so focused on the details that I could have missed something from the big picture.

