Log Analytics for Power BI: How to start and improve insights for better model performance
I had a task to help a managed services team in monitoring multiple production datasets and reports in Power BI. These resources, accessed by thousands of users, demanded optimal performance. For this we had to streamline information gathering, implement an intuitive platform, and empower the team to explore both high-level overviews and granular query details.
This was a perfect opportunity to work with Log Analytics for Power BI and to dig deep into the data and find ways to advance the available solutions.
What is Azure Log Analytics?
- Azure Log Analytics (LA) is a service within Azure Monitor that Power BI uses to save activity logs.
- Azure Monitor enables you to collect, analyze, and act on telemetry data from both Azure and on-premises environments.
- Key features of Azure Log Analytics include long-term storage, an ad-hoc query interface, and API access for data export and integration with other systems.
How does the integration work?
- Power BI integrates with Log Analytics to expose events from the Analysis Services engine.
- These events are derived from existing diagnostic logs available for Azure Analysis Services.
- Once connected to Power BI, data is sent continuously and becomes available in Log Analytics in approximately 5 minutes.
- Integration is on the Workspace level, which allows selective data collection and better cost control.
- Only work with Workspaces in a Premium capacity
- By default 30 days of data is preserved. This can be modified and there are options for archiving.
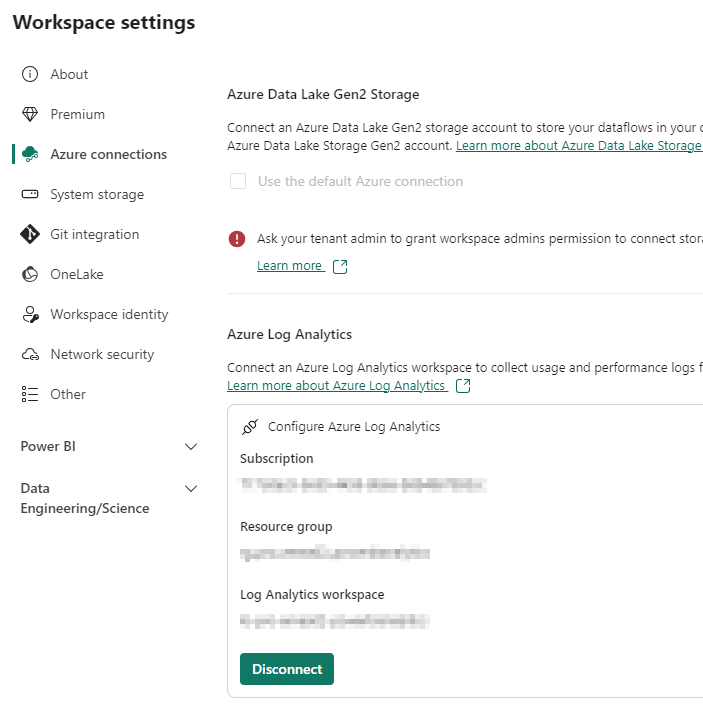
If you need further guidance on setting up Log Analytics, refer to the official documentation. 🚀
Analyzing collected data
In Azure
In the Azure Portal you can analyse the data in the Logs section of the Log Analytics Workspace.
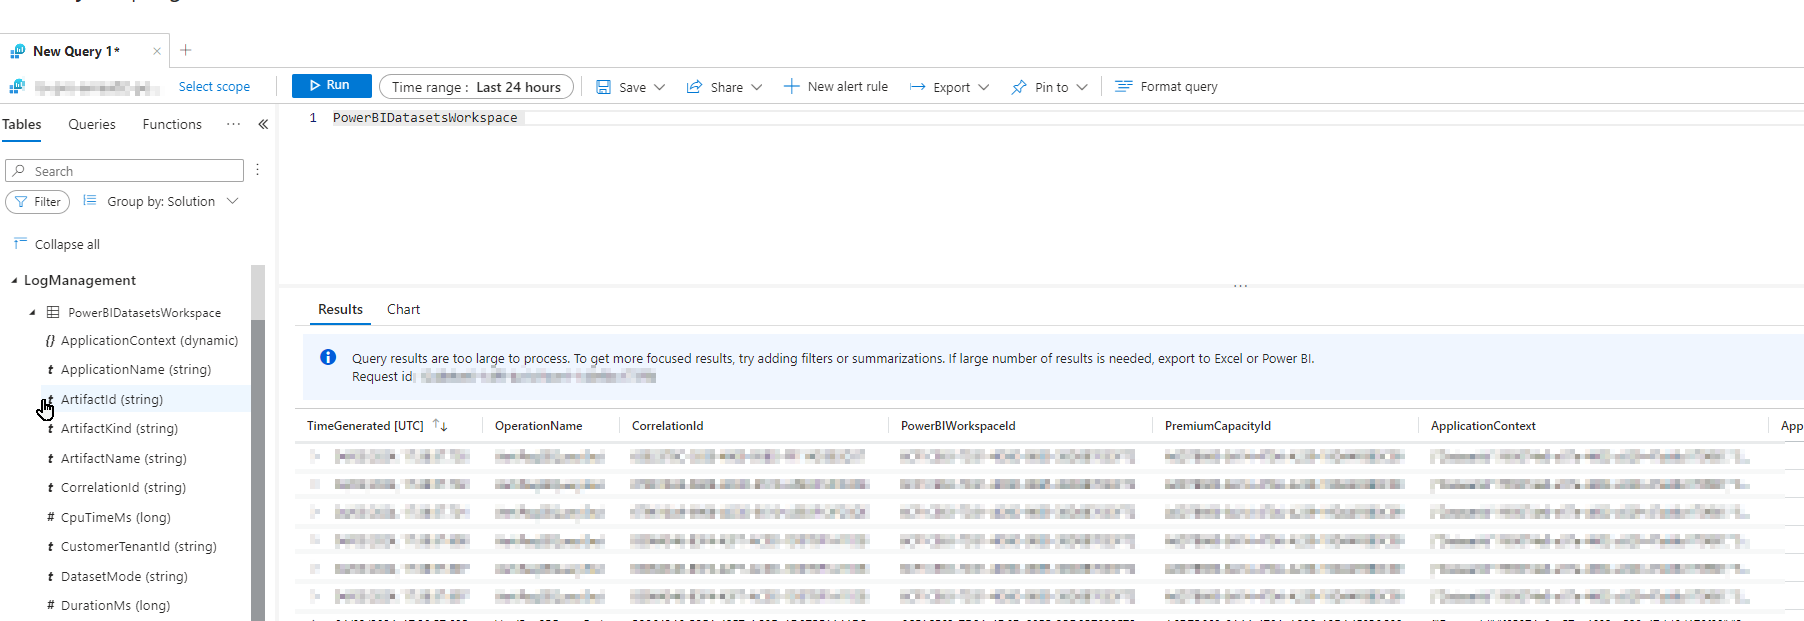
Here is the official tutorial that help getting familiar with the https://learn.microsoft.com/en-us/azure/azure-monitor/logs/log-analytics-tutorial
⚠️There is a big limitation of analysing data from Log Analytics which is the limited query resultset size. It is the same if you are analysing the data in Azure or connecting through the API via Power BI. You can see that in the notification in the picture above. ⚠️
In Power BI
Fortunately Rui Romano, Bravik Merchant and other from Microsoft contributors created a really useful Power BI report template to analyse Log Analytics data.
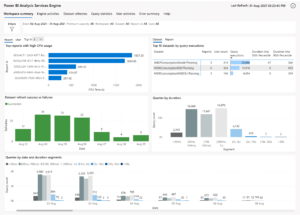
Power BI Log Analytics Template Reports: https://github.com/microsoft/PowerBI-LogAnalytics-Template-Reports
This is a brilliant report that provided a wide range of insights about both model query and refresh performance. I highly recommend to use if you plan to implement Log Analytics at your organization.

The solution also resolved the data volume issue by querying Log Analytics in increments:
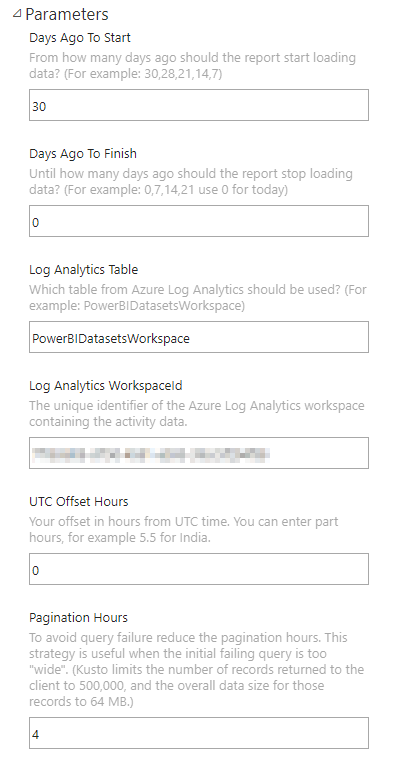
But something was missing...
As I implemented the solution at one of the projects I noticed that there was no way in the template report to attribute a query to a particular visual. The reports that connected to the models had multiple pages and potentially more than 100 visual elements, this made finding the problematic visuals quite hard.
So I started searching through the logs to see if there is any information available that would help. As you can see in the image the Visual details were buried in the Application Context column.

How to add the missing piece?
Because the report is really sophisticated it took me a while to understand its inner workings and also received some help from Will Cisler, thank you for that!
Add Visual ID to the data
First we need to modify the Power Query and embedded KQL code to add the missing element.
As a starting point extend fnGetOperationsExceptRefreshes function:
    | extend Sources = parse_json(ApplicationContext).Sources
    | mv-expand Sources
    | extend ReportId = tostring(parse_json(Sources).ReportId)
    | extend VisualId = tostring(parse_json(Sources).VisualId)
    | extend TextDataHash = hash(EventText)
    | extend DurationMs = coalesce(DurationMs, 0)
    | extend User = iff(toupper(PowerBIWorkspaceId) in (workspaceIdList), hash_md5(User), User)
    | extend ExecutingUser = iff(toupper(PowerBIWorkspaceId) in (workspaceIdList), hash_md5(ExecutingUser), ExecutingUser)
    | distinct  ApplicationName, CpuTimeMs, ArtifactId, ArtifactName, ArtifactKind, DatasetMode, DurationMs, EventText, ExecutingUser, OperationDetailName, OperationName, PremiumCapacityId, ReportId, SourceSystem, Status, StatusCode, TenantId, TextDataHash, TimeGenerated, Type, User, PowerBIWorkspaceId, PowerBIWorkspaceName, XmlaRequestId, XmlaSessionId, _ResourceId, _SubscriptionId, VisualId
    | extend QuerySubeventKey = case(
        OperationName == 'QueryEnd' and isnotempty(XmlaRequestId), XmlaRequestId,  // add rootActivityId as the key if this is a QueryEnd. This joins to the Suboperation table.
        dynamic(null)) // if we are not expecting subevents then make this null. In PowerQuery we will add a dummy index value for null values to keep this column unique for the 1:* relationship
    | project-rename DatasetId = ArtifactId, Dataset = ArtifactName, StartTime = TimeGenerated, ResourceId = _ResourceId, SubscriptionId = _SubscriptionId,  ['Duration (ms)'] = DurationMs, VisualGUID = VisualId
"],Timeout=#duration(0,0,60,0)])),
⚠️There might be other parts of the solution need to be adjusted to let this new column to flow through the pipeline.⚠️
Add Visual Details Page to the Report
Finding the visuals that cause the performance issue was our main goal, so I created a page dedicated to showcase query summary by visuals. Also added some time analysis to show how changes in usage or improvements in the solution affect the performance.
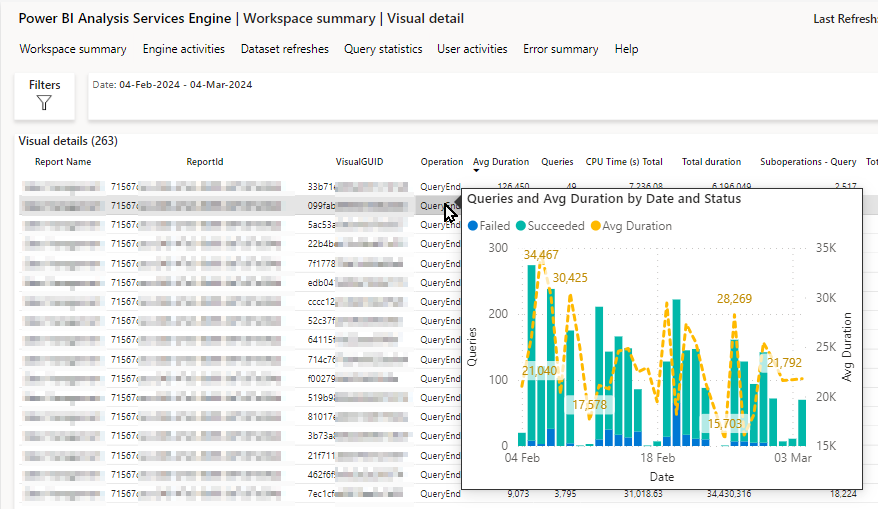
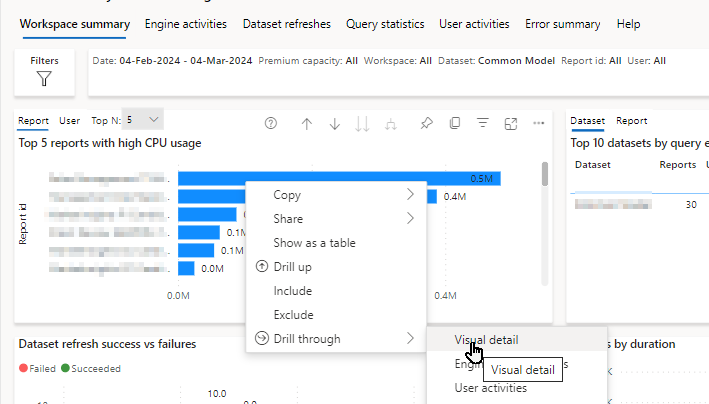
To connect the page with the rest of the report a drill through was added from the Workspace summary page to the Visuals details.
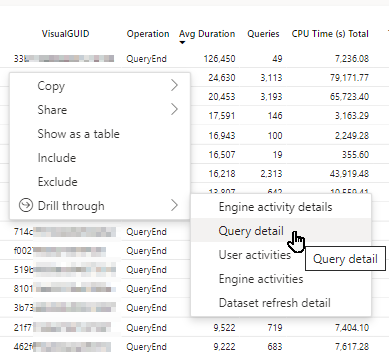
Also from the Visual details to the Query details to understand how each query performs.
Real life examples of performance improvements using Log Analytics
Here are some examples that we were able to achive with analysing Log Analytics data with our current setup.
- Slow table visual (40s+) that was designed for exporting data running more than 3.000 time in 2 weeks, was moved to a separate drill through page (Progressive Disclosure). Turns out nobody really wanted to export data because it only run less then 20 times in the next 2 weeks.
- Complex DAX issue causing visual to failed after running for more than 4 minutes. Corrected the calculation, now it runs under 10 seconds.
- Legacy, currently unnecessary filters in some visuals for "data cleansing" removed improving query performace from 60 sec to 2 sec.
What's next?
Unfortunately currently in Power BI there is no option to extract report metadata information from the published reports through the Power BI APIs.
In my next blog post I will show how you can find the exact details of a visual and page in a PBIX file manually, what are the community built options and how Fabric APIs will help.


