
Semi geocoded data in Power BI Maps
Recently encountered a dataset that only partially had latitude and longitude information and observed some strange behaviour that I was unaware before. So I decided I do a little exploration to find out how geocoding works in Power BI.
I will test it on 4 visuals that I most commonly use for mapping. There are others there that might behave differently.
Data
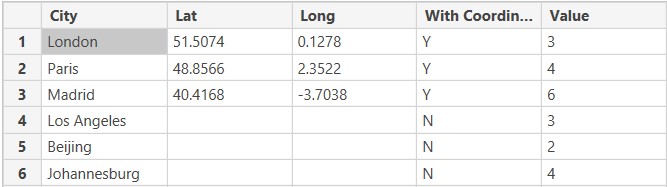
The data I used is simple to make it easy to spot difference in behaviour.
Map visual
Let's start with the most commonly used Map visual first.
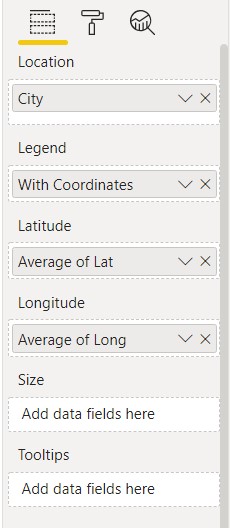
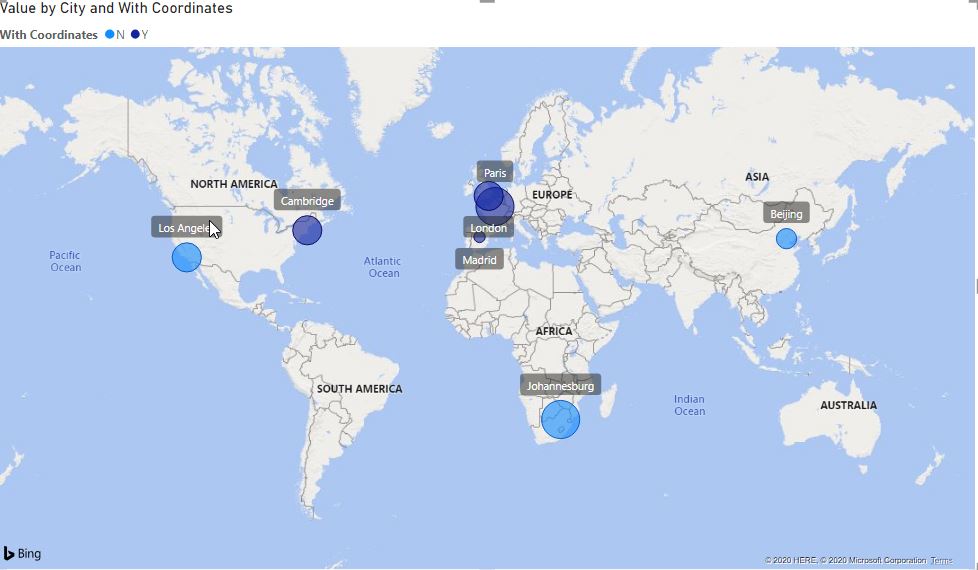
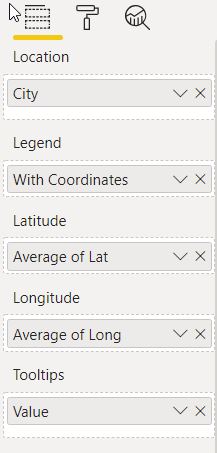
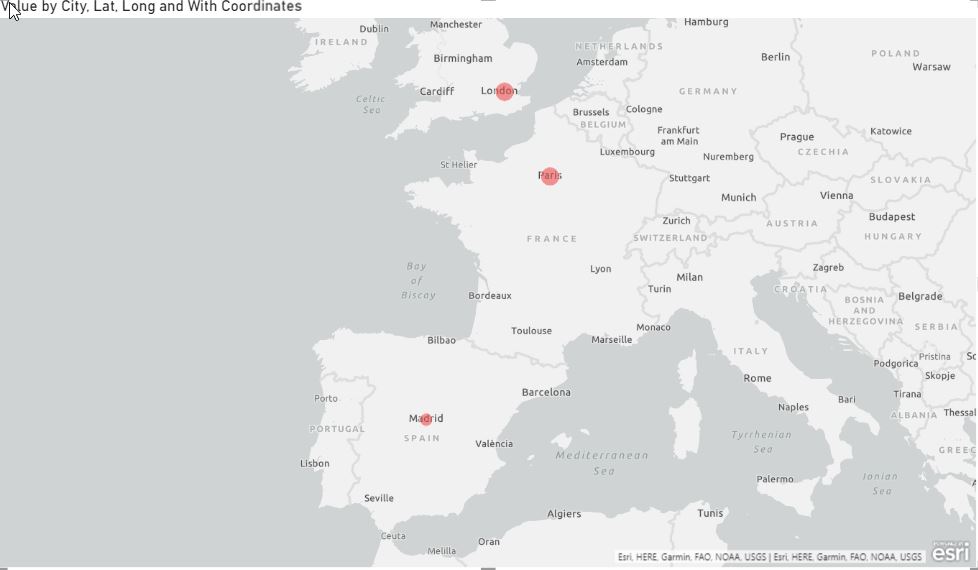
I added City in Location, Average Lat and Long in the Coordinates section and the With Coordinates column to the Legend.
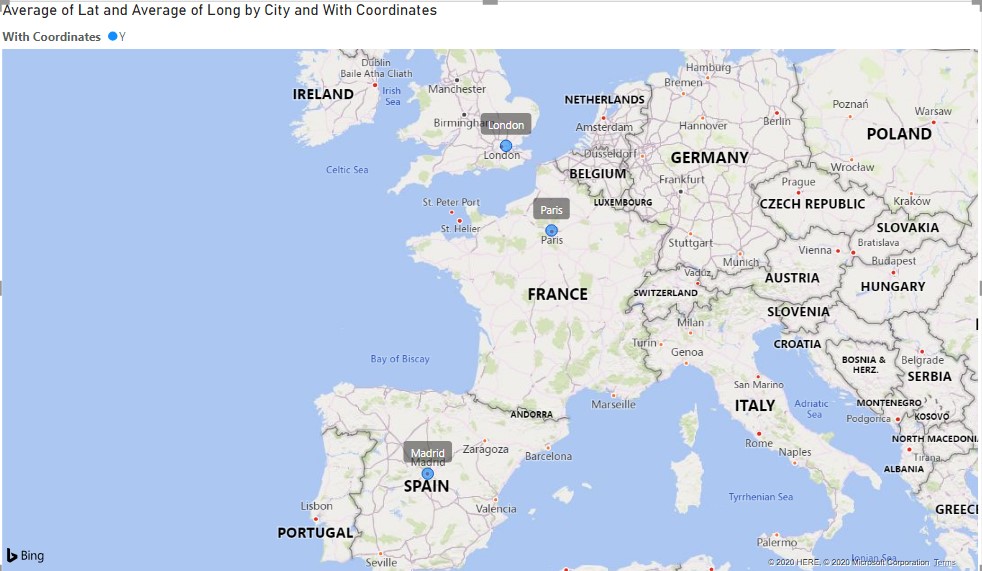
As you can see that only those cities are shown that have coordinates.
This is what I expected and experienced before.
Notice that the Size field is empty currently.
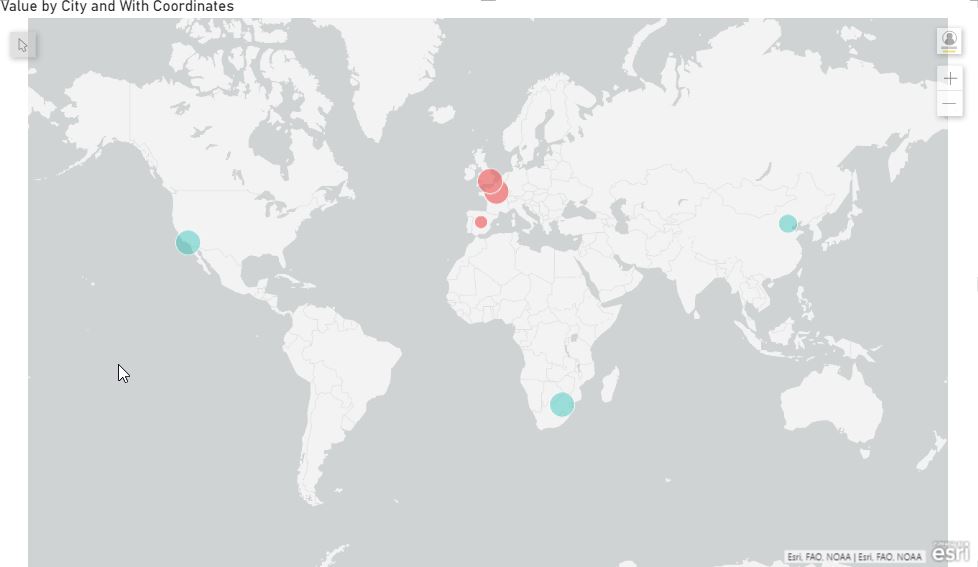
What happens if I add a measure into size?
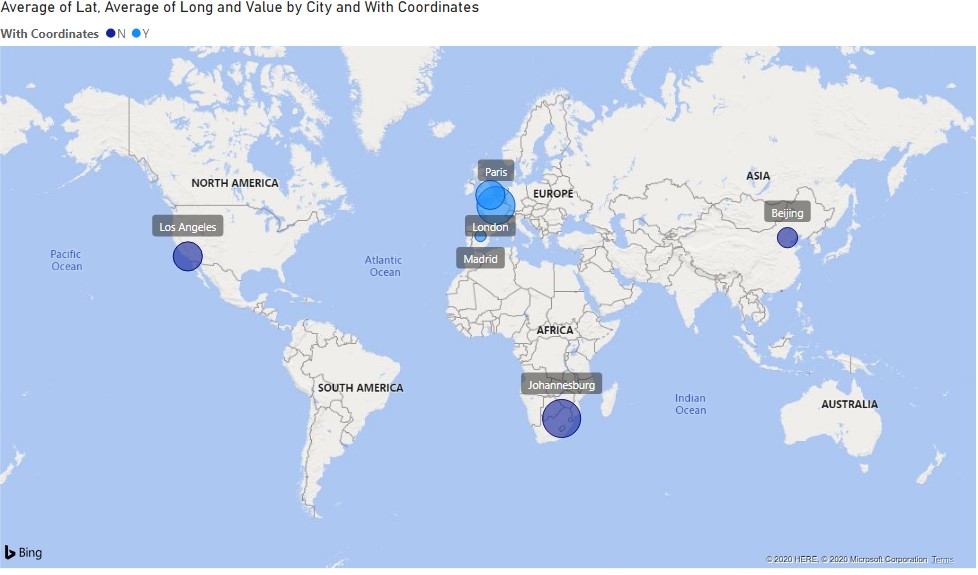
My initial expectation was that the previous behaviour won't change.
As you can see that know all the cities are shown.
I started to wonder that what is happening here.
Are all the points are sent to bing to geocode or only those that does not have that information in the data?
Unfortunately the cities currently in the data would be in the right place regardless.

Let's add Cambridge to the mix
I had to find a city that was not geocoded correctly by the Bing Map API.
Correctly in this case means: did not found the city I was looking for, but another one in another country.
UK cities are generally a good examples for this because they are more likely to have US or Australian counterparts for some reason. :)
One example is Cambridge. So I added one more line to the dataset.

I wanted to try it without using coordinates first just to verify that it shows a different Cambridge.
Once I added a Latitude and Longitude information the city appeared in the right place.
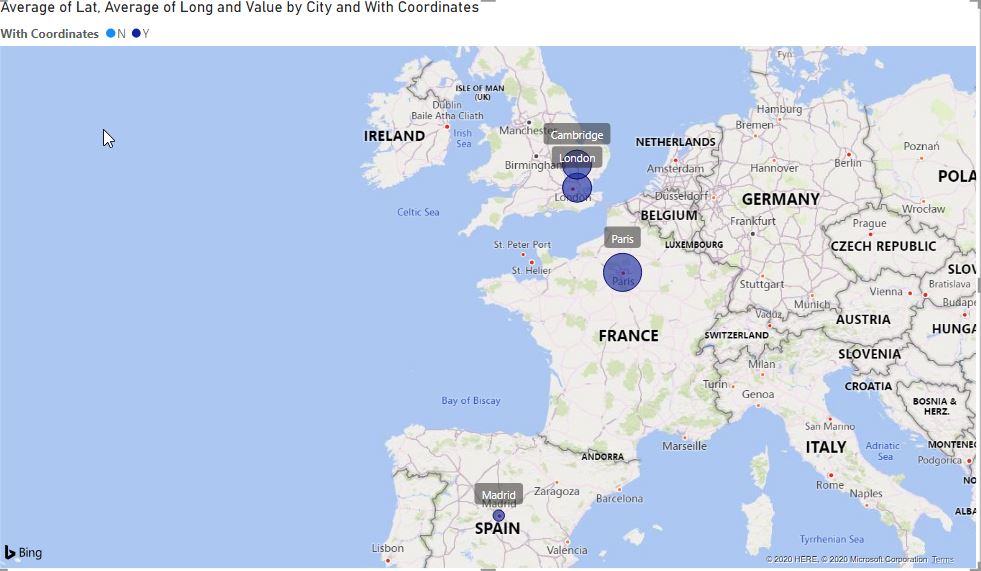
So it seems that the map visual uses the information that are in the data and tries to geocode for the missing values if you have a measure in the size column.
In practical terms it means that this behaviour can be utilized that you only need to provide geocodes for those locations that are not recognized correctly by the Bing Map API.
Filled Map visual
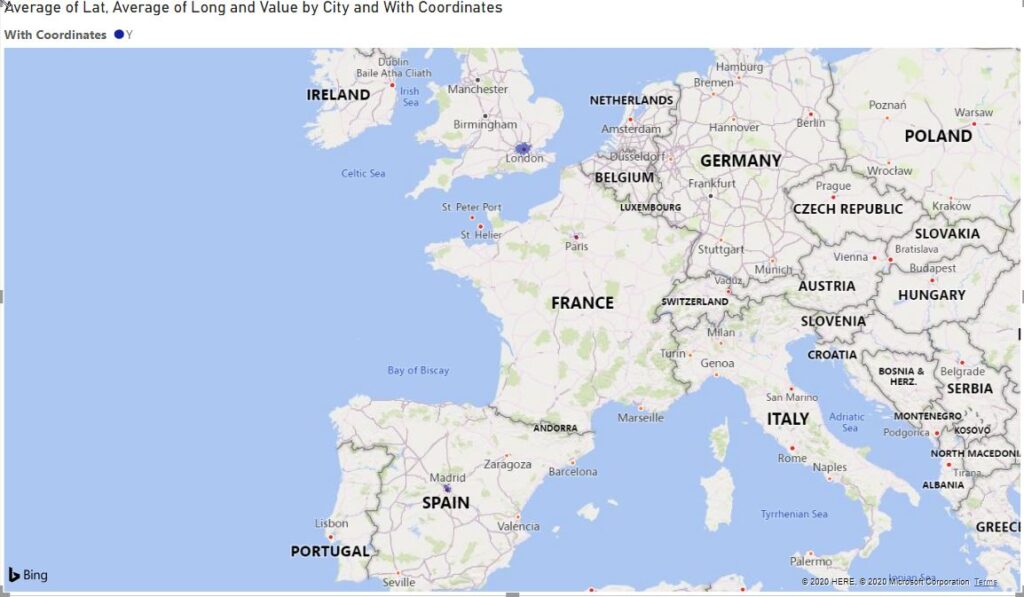
Filled Maps behave differently because they don't have a size option.
You can add conditional formatting but that does not change this behaviour.
It will still only show the locations that have latitude and longitude information.
If you remove the Latitude and Longitude data, then it will revert back to the Bing Map API and it will show all the cities (some of them potentially not where you want)
ESRI Map visual
Esri Map behaves similar to Filled Maps.
Icon Map by Altius
Icon Map is a great visual to do complex geographical analytics, I highly recommend for you to try it out. It was created by James Dales (MVP).
Link to the Visual in AppSource
Because this is a custom visual it is a bit different.
It needs geocodes to show points in the map. So it will only work with the already geocoded data.
Hope this blog post gave you some good ideas in mapping.

