Self-Service Business Intelligence

How to make SSBI work – A blog for data analysts and decision makers

  • Blog
  • Categories
    • Big Picture
    • Analytics Edge
    • Improve the Experience
    • Get to the Data
    • Governance is key
  • About the Blog
  • GitHub
  • Useful Links
  • Power BI Features
  • Contact Me
  • Improve the Experience

Semi geocoded data in Power BI Maps

16/02/2020
by Mihaly Kavasi
3 min read

Recently encountered a dataset that only partially had latitude and longitude information and observed some strange behaviour that I was unaware before. So I decided I do a little exploration to find out how geocoding works in...

Continue reading

Open Data
  • Big Picture
  • Get to the Data

How to increase the value of your data – Open data in the UK

07/11/2019
by Mihaly Kavasi
3 min read

When we talk about getting insights out of data to drive decisions we generally think about “our” data that we collect. A value of our data is defined by value our decisions generate using that data. What if you...

Continue reading

Power BI Admin
  • Improve the Experience

Why understanding administration matters for customer experience

07/11/2019
by Mihaly Kavasi
1 min read

I recently appear in Data Lounge talking about Power BI Administration. We went through with Alejandro on the most important setting from the tenant settings. There were some settings where we looked at the different layers...

Continue reading

  • Improve the Experience

Quick Idea: Let the consumers change the report design

23/09/2019
by Mihaly Kavasi
2 min read

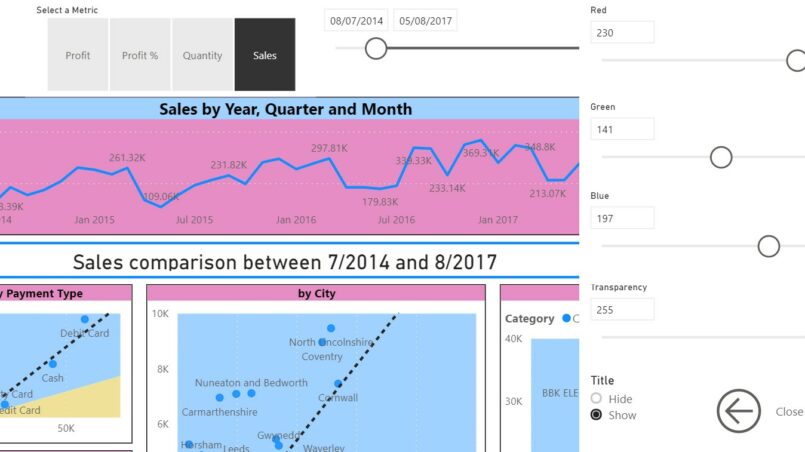
In the September 2019 version of Power BI new dynamic conditional formatting options appeared. So I thought it’s time to talk about the possibilities that open up once all the different aspects of a visual can be...

Continue reading

Explain the change
  • Analytics Edge

Explain the Change between any two month

03/09/2019
by Mihaly Kavasi
3 min read

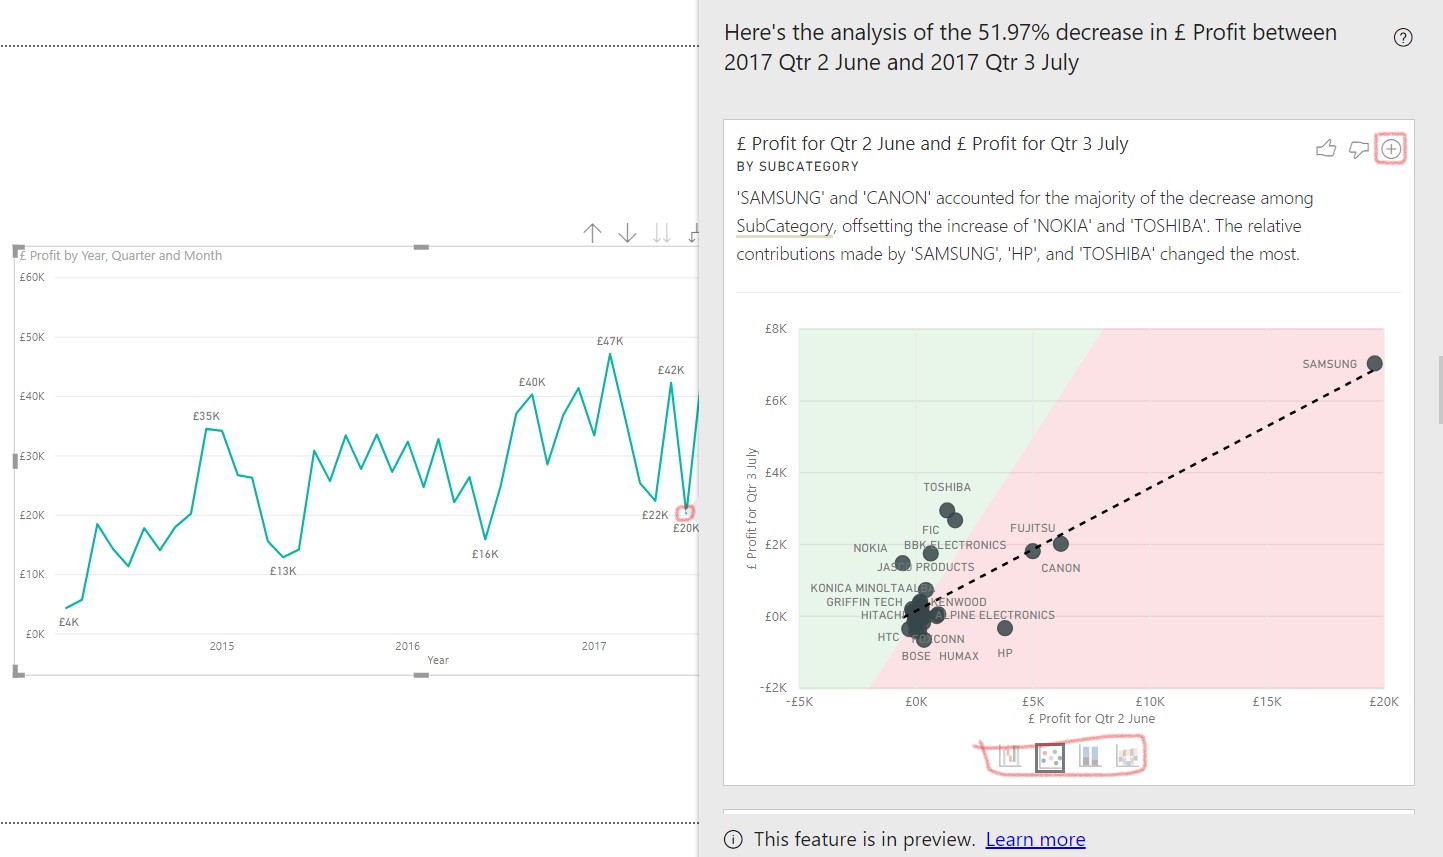
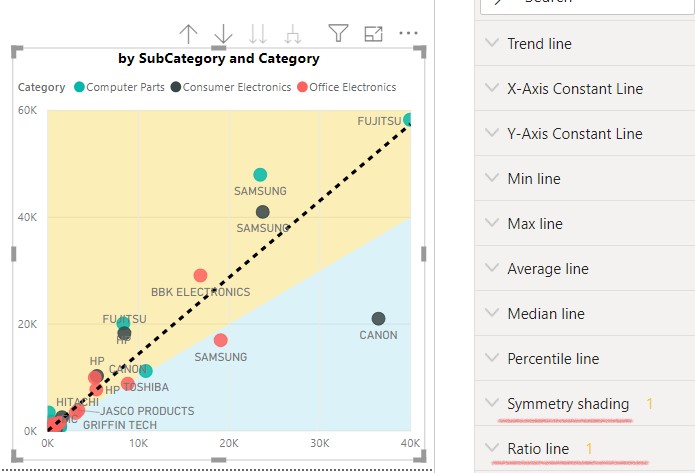
I started collecting the different built-in analytics capabilities of Power BI. (You can find Part 1 and Part 2 here.) As I went through all the possibilities I found that I really miss the ability to define the 2 months I would...

Continue reading

  • Analytics Edge

Built-in Analytics in Power BI – Part 2 – Analyze

29/08/2019
by Mihaly Kavasi
4 min read

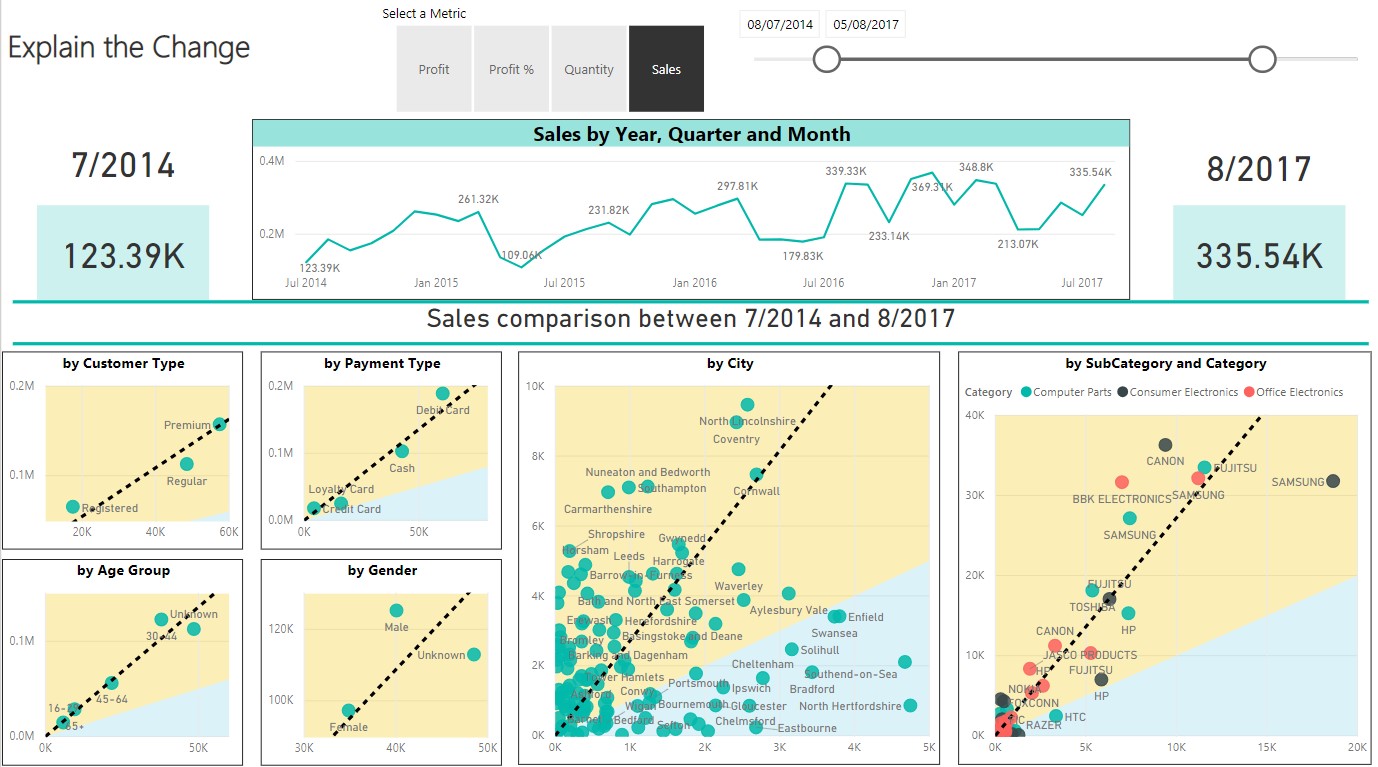
In this part of the series we will look into the different Analyze options of Power BI. Previous part of this series can be found here. Explain the Increase/Decrease This is the first type of the Analyze features. If...

Continue reading

Profit % with total in tooltip
  • Analytics Edge

Undocumented Features: Analytics for measures not visible

21/08/2019
by Mihaly Kavasi
2 min read

As I work with Power BI sometimes I encounter strange behaviours that I not heard before, and sometimes feel unintentional by the developers. I have to be honest I am not sure it is not documented, I just did not found it. The...

Continue reading

Visual Headers
  • Improve the Experience

Updated: Using the Visual Headers

09/08/2019
by Mihaly Kavasi
3 min read

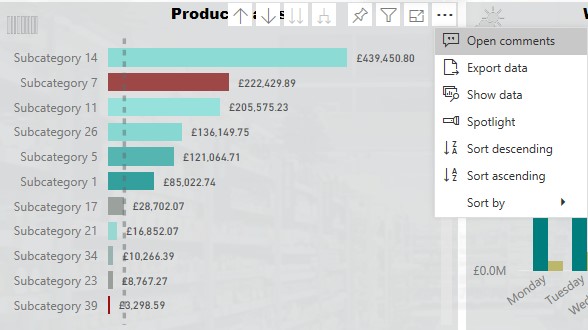
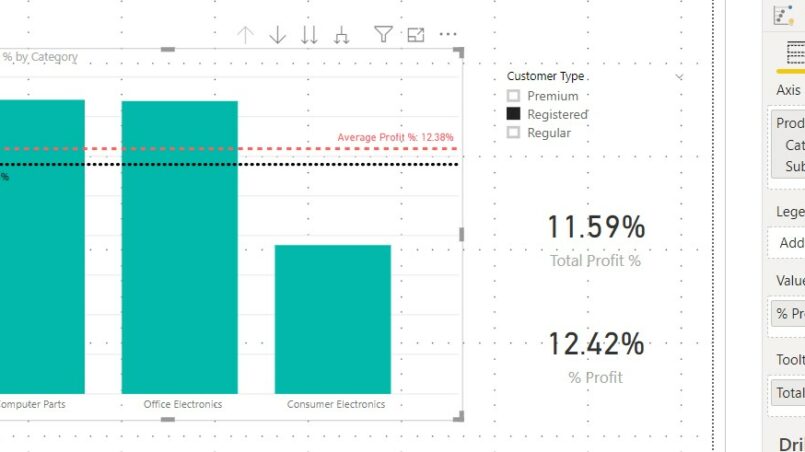
I updated the post, because I left out some important aspects. Anyone who is a regular user of Power BI knows about the Visual Headers. It gives us a lot of really useful functionalities and sometime a bit of headache...

Continue reading

Scatter Plot with Analytics
  • Analytics Edge

Built-in Analytics in Power BI – Part 1: Visuals

07/08/2019
by Mihaly Kavasi
4 min read
3 Comments

In this blog series, I will cover all of Power BI’s built-in analytical capabilities. Basically, anything that doesn’t require you to know the DAX (Data Analysis Expressions) language. These can help you find...

Continue reading

Combine Files
  • Get to the Data

Getting Files (Folders) from SharePoint or OneDrive into Dataflows

06/08/2019
by Mihaly Kavasi
5 min read

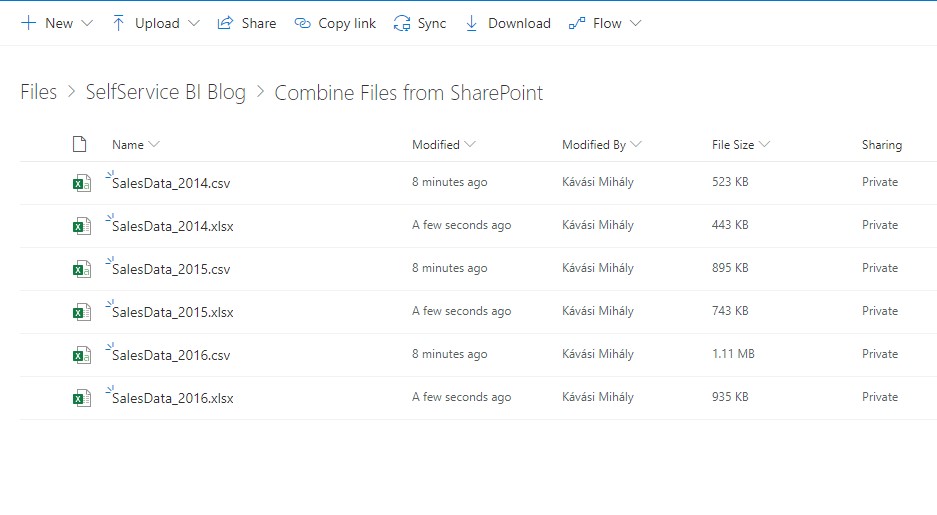
With the introduction of Dataflows in Power BI, the platform’s capabilities have increased quite a bit. (Note: I’ll do a detailed overview of Dataflows in another post.) Dataflows became generally available not...

Continue reading

Previous 1 2 3 4 Next
Facebook
fb-share-icon
Twitter
Visit Us
Follow Me
Post on X
LinkedIn
LinkedIn
Share

Sign up to receive notification

If you want to be notified when a new blog post is published, then sign up here.

Categories

  • Analytics Edge (11)
  • Big Picture (6)
  • Get to the Data (9)
  • Governance is key (7)
  • Improve the Experience (17)
  • Uncategorized (2)

Tags

Administration (1) Adoption (1) Analyze in Excel (3) API (1) Best Practice (4) C# (1) Consumers (2) CX (8) Data Model (7) data quality (1) Dataset (5) DAX (4) DAX Studio (1) documentation (4) Engagement (1) Excel (4) Export (1) Featured Tables (1) FTRSA (1) Governance (2) Log Analytics (1) Management (3) Maps (1) Open Data (1) Optimization (2) Parameters (1) Performance (2) Perspectives (1) Premium Capacity (1) Productivity (1) programmability (1) Recognition (1) Report Design (5) Scripting (1) Security (2) Sensitive Data (1) Service (3) Slicers (1) Support (1) Tabular Editor (3) Tenant (2) Tenant Administration (1) Tips and Tricks (2) Video (1) Visualization (2)

Archives

  • March 2024 (2)
  • August 2022 (1)
  • July 2022 (3)
  • June 2022 (2)
  • May 2022 (1)
  • October 2021 (1)
  • July 2021 (2)
  • June 2021 (1)
  • May 2021 (2)
  • April 2021 (2)
  • August 2020 (1)
  • March 2020 (1)
  • February 2020 (2)
  • November 2019 (2)
  • September 2019 (2)
  • August 2019 (7)
  • July 2019 (1)
Copyright © 2025. Created by Meks. Powered by WordPress.
  • Blog
  • Categories
    • Big Picture
    • Analytics Edge
    • Improve the Experience
    • Get to the Data
    • Governance is key
  • About the Blog
  • GitHub
  • Useful Links
  • Power BI Features
  • Contact Me