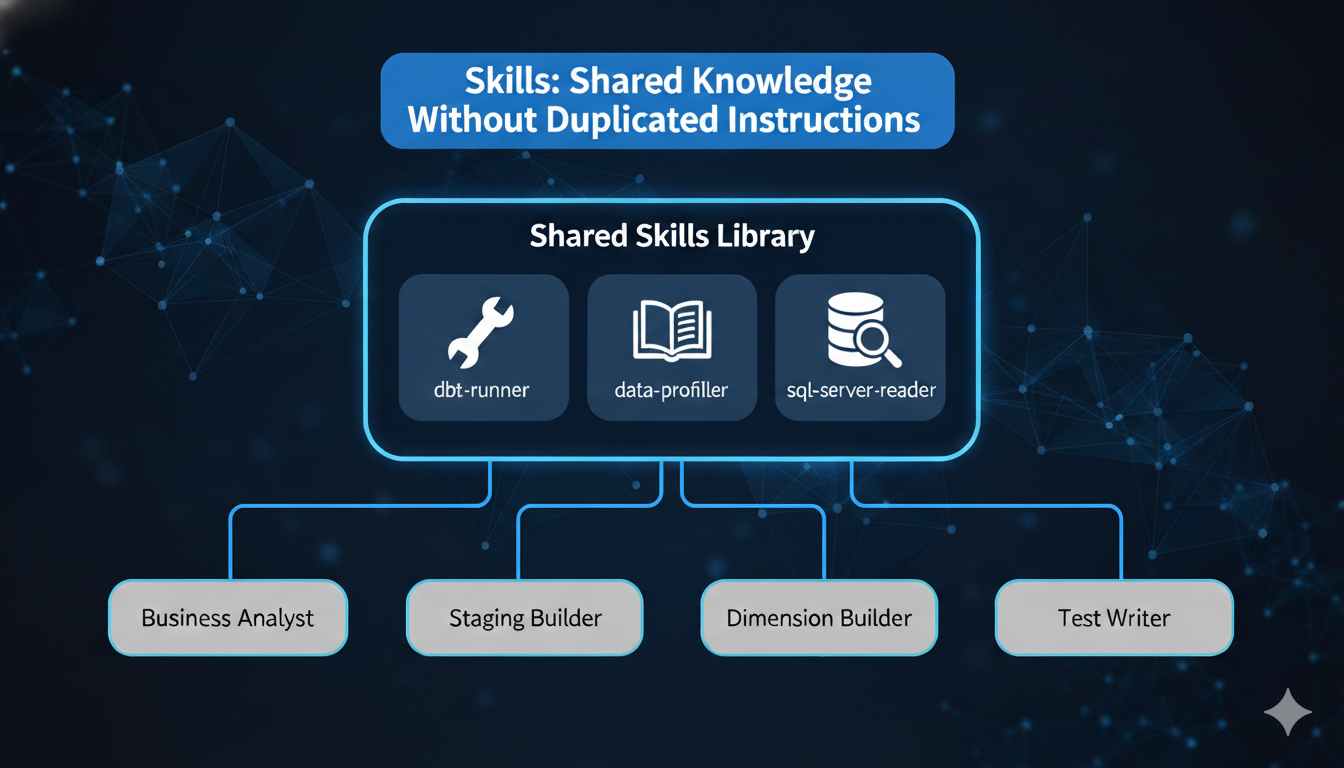
Self-Service Business Intelligence

How to make SSBI work – A blog for data analysts and decision makers

  • Blog
  • Categories
    • Big Picture
    • Analytics Edge
    • Improve the Experience
    • Get to the Data
    • Governance is key
  • About the Blog
  • GitHub
  • Useful Links
  • Power BI Features
  • Contact Me
  • Get to the Data
  • Governance is key
  • Improve the Experience

How to find which visual generated the query in Log Analytics?

11/03/2024
by Mihaly Kavasi
4 min read

Model metadata in Power BI is getting more and more accessable and there are a fair amount of tool that we can use to work with it. Report metadata on the otherhand is not easy to work with. In my previous blog post, I showed...

Continue reading

  • Get to the Data
  • Governance is key

Log Analytics for Power BI: How to start and improve insights for better model performance

05/03/2024
by Mihaly Kavasi
6 min read

I had a task to help a managed services team in monitoring multiple production datasets and reports in Power BI. These resources, accessed by thousands of users, demanded optimal performance.  For this we had to streamline...

Continue reading

New Page Available: Explore Power BI features with Power BI
  • Big Picture

New Page Available: Explore Power BI features with Power BI

04/08/2022
by Mihaly Kavasi
1 min read

I spend a lot of time going through the Power BI documentation to find answers about Power BI features. As always, I look for opportunities to make my life easier when I need to look through of data. What better tool for this...

Continue reading

  • Analytics Edge
  • Get to the Data
  • Improve the Experience

Hidden features of Analyze in Excel – Part 3 – Focus

15/07/2022
by Mihaly Kavasi
3 min read

In the first two parts (part 1 and part 2) of the blog we explored the Show details functionality of a Pivot table in Excel. Now we look at another hidden feature that will help you limit distractions. Whenever you connect to...

Continue reading

  • Analytics Edge
  • Get to the Data
  • Improve the Experience

Hidden features of Analyze in Excel – Part 2 – Give me all the data

11/07/2022
by Mihaly Kavasi
3 min read

This blog series is about the hidden features in Analyze in Excel. There are lot of tiny details which can help the adoption of Power BI for Excel users. In this blog we are going to talk about increasing the records retrieved by...

Continue reading

  • Analytics Edge
  • Get to the Data
  • Improve the Experience

Hidden features of Analyze in Excel – Part 1 – Show me the details

07/07/2022
by Mihaly Kavasi
4 min read
1 Comment

This blog series is about the hidden features in Analyze in Excel. There are lot of tiny details which can help the adoption of Power BI for Excel users. In this blog we are going to talk about Detail Rows Expressions.

Continue reading

  • Get to the Data
  • Improve the Experience

Organizational Data Types – Supercharge your Excel users’ productivity

29/06/2022
by Mihaly Kavasi
4 min read

Data Types has been part of Excel for some time now, but a lot of people is not familiar with it. You can find them under the Data tab. You might have wondered what they are for? They are built-in datasets about common...

Continue reading

  • Governance is key

Documenting Power BI – Data model V2 – Now with VertiPaq included

27/06/2022
by Mihaly Kavasi
3 min read

It has been a while I published about Documenting a data model in Power BI. I thought I would update the solution with some added features to make the documentation more complete. Updated the meta data that can be extracted...

Continue reading

  • Analytics Edge
  • Improve the Experience

Dynamic Comparison values using Field Parameters

23/05/2022
by Mihaly Kavasi
2 min read

I have been reading a lot of good feedback of the Power BI May 2022 update especially and the introduction of field parameters. Do not want to go into details what it is, because the official blog post and video gives a good...

Continue reading

  • Analytics Edge
  • Improve the Experience

Slicers or Filters – Comprehensive Guide

25/10/2021
by Mihaly Kavasi
8 min read

Slicer and filter were around in Power BI for a long time now, and plenty of blog posts were created comparing them to each other. Because these features constantly get updated and there are considerations outside of just a...

Continue reading

1 2 3 4 Next
Facebook
fb-share-icon
Twitter
Visit Us
Follow Me
Post on X
LinkedIn
LinkedIn
Share

Sign up to receive notification

If you want to be notified when a new blog post is published, then sign up here.

Categories

  • Analytics Edge (11)
  • Big Picture (6)
  • Get to the Data (9)
  • Governance is key (7)
  • Improve the Experience (17)
  • Uncategorized (2)

Tags

Administration (1) Adoption (1) Analyze in Excel (3) API (1) Best Practice (4) C# (1) Consumers (2) CX (8) Data Model (7) data quality (1) Dataset (5) DAX (4) DAX Studio (1) documentation (4) Engagement (1) Excel (4) Export (1) Featured Tables (1) FTRSA (1) Governance (2) Log Analytics (1) Management (3) Maps (1) Open Data (1) Optimization (2) Parameters (1) Performance (2) Perspectives (1) Premium Capacity (1) Productivity (1) programmability (1) Recognition (1) Report Design (5) Scripting (1) Security (2) Sensitive Data (1) Service (3) Slicers (1) Support (1) Tabular Editor (3) Tenant (2) Tenant Administration (1) Tips and Tricks (2) Video (1) Visualization (2)

Archives

  • March 2024 (2)
  • August 2022 (1)
  • July 2022 (3)
  • June 2022 (2)
  • May 2022 (1)
  • October 2021 (1)
  • July 2021 (2)
  • June 2021 (1)
  • May 2021 (2)
  • April 2021 (2)
  • August 2020 (1)
  • March 2020 (1)
  • February 2020 (2)
  • November 2019 (2)
  • September 2019 (2)
  • August 2019 (7)
  • July 2019 (1)
Copyright © 2025. Created by Meks. Powered by WordPress.
  • Blog
  • Categories
    • Big Picture
    • Analytics Edge
    • Improve the Experience
    • Get to the Data
    • Governance is key
  • About the Blog
  • GitHub
  • Useful Links
  • Power BI Features
  • Contact Me