
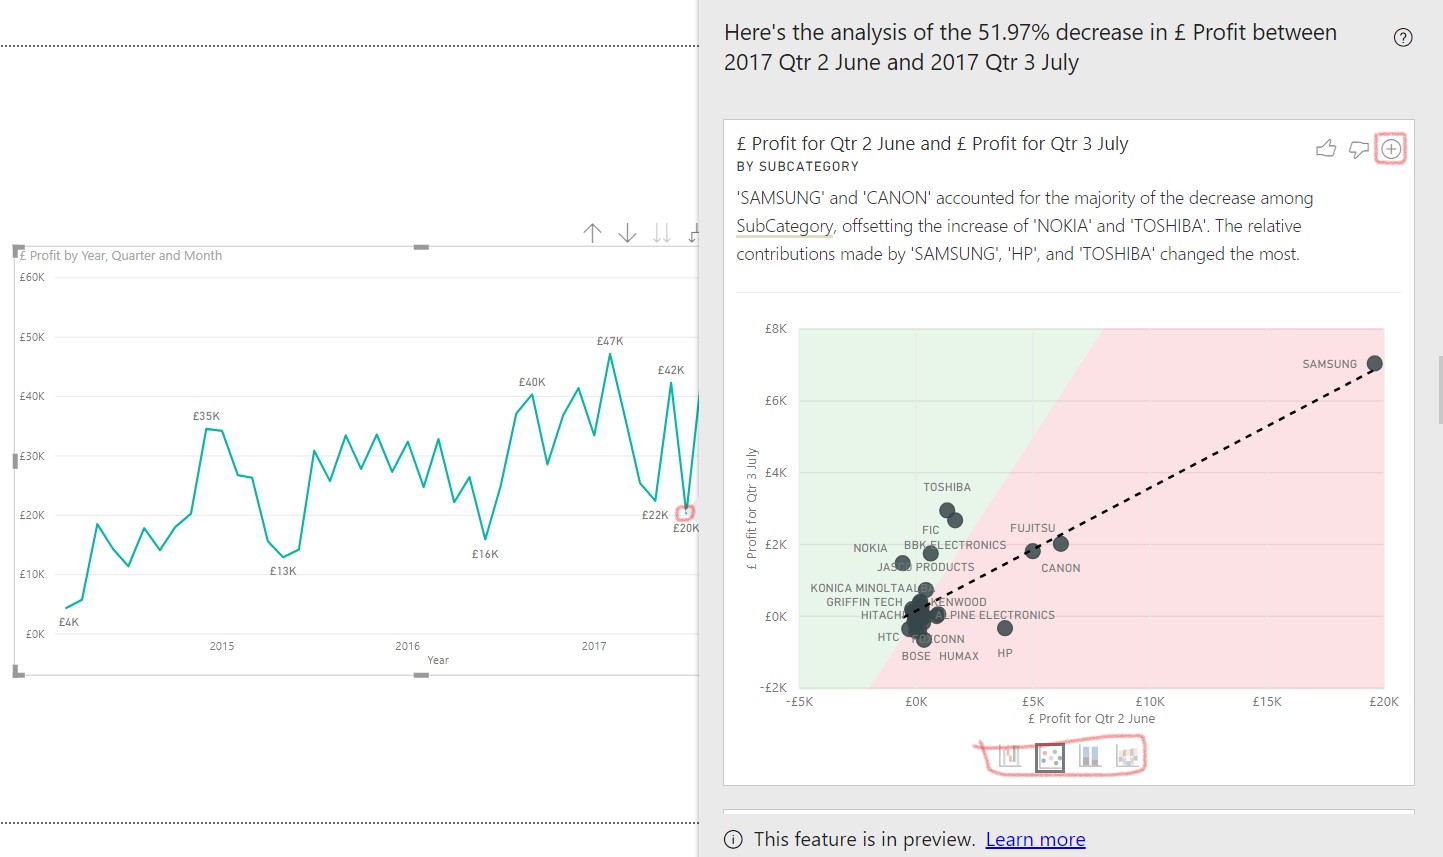
In this part of the series we will look into the different Analyze options of Power BI. Previous part of this series can be found here. Explain the Increase/Decrease This is the first type of the Analyze features. If...
Archive - August 2019
As I work with Power BI sometimes I encounter strange behaviours that I not heard before, and sometimes feel unintentional by the developers. I have to be honest I am not sure it is not documented, I just did not found it. The...
I updated the post, because I left out some important aspects. Anyone who is a regular user of Power BI knows about the Visual Headers. It gives us a lot of really useful functionalities and sometime a bit of headache...
In this blog series, I will cover all of Power BI’s built-in analytical capabilities. Basically, anything that doesn’t require you to know the DAX (Data Analysis Expressions) language. These can help you find...
With the introduction of Dataflows in Power BI, the platform’s capabilities have increased quite a bit. (Note: I’ll do a detailed overview of Dataflows in another post.) Dataflows became generally available not...
When we create dashboards from reports, it is a quite an easy task. Just use the Pin Visuals icon. But under the hood this has some cool functionality that might not be visible at first glance. I will use an example to...

Learn what self-service means to me as a data analyst. Note: This post will contain a lot of subjective opinion based on my experience. What does it mean to be truly self-service? It is not an easy question to answer...