Self-Service Business Intelligence

How to make SSBI work – A blog for data analysts and decision makers

  • Blog
  • Categories
    • Big Picture
    • Analytics Edge
    • Improve the Experience
    • Get to the Data
    • Governance is key
  • About the Blog
  • GitHub
  • Useful Links
  • Power BI Features
  • Contact Me

Tag - Visualization

  • Improve the Experience

Semi geocoded data in Power BI Maps

16/02/2020
by Mihaly Kavasi
3 min read

Recently encountered a dataset that only partially had latitude and longitude information and observed some strange behaviour that I was unaware before. So I decided I do a little exploration to find out how geocoding works in...

Continue reading

  • Improve the Experience

Quick Idea: Let the consumers change the report design

23/09/2019
by Mihaly Kavasi
2 min read

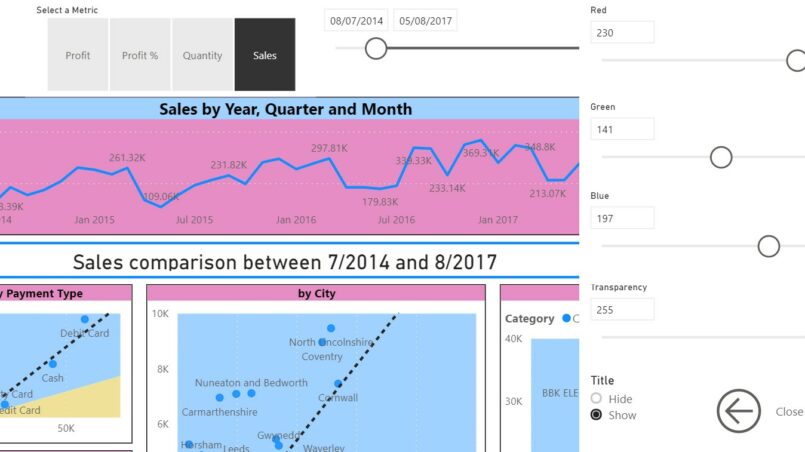
In the September 2019 version of Power BI new dynamic conditional formatting options appeared. So I thought it’s time to talk about the possibilities that open up once all the different aspects of a visual can be...

Continue reading

Copyright © 2025. Created by Meks. Powered by WordPress.
  • Blog
  • Categories
    • Big Picture
    • Analytics Edge
    • Improve the Experience
    • Get to the Data
    • Governance is key
  • About the Blog
  • GitHub
  • Useful Links
  • Power BI Features
  • Contact Me